Copyright © 2006, 2021 The Apache Software Foundation
Copyright © 2004, 2006 International Business Machines Corporation
License and Disclaimer
The ASF licenses this documentation to you under the Apache License, Version 2.0 (the "License"); you may not use this documentation except in compliance with the License. You may obtain a copy of the License at
Unless required by applicable law or agreed to in writing, this documentation and its contents are distributed under the License on an "AS IS" BASIS, WITHOUT WARRANTIES OR CONDITIONS OF ANY KIND, either express or implied. See the License for the specific language governing permissions and limitations under the License.
Trademarks
All terms mentioned in the text that are known to be trademarks or service marks have been appropriately capitalized. Use of such terms in this book should not be regarded as affecting the validity of the the trademark or service mark.
1. Component Descriptor Editor User’s Guide
The Component Descriptor Editor is an Eclipse plug-in that provides a forms-based interface for creating and editing UIMA XML descriptors. It supports most of the descriptor formats, except the Collection Processing Engine descriptor, the PEAR package descriptor and some remote deployment descriptors.
1.1. Launching the Component Descriptor Editor
Here’s how to launch this tool on a descriptor contained in the examples. This presumes you have installed the examples as described in the SDK Installation and Setup chapter.
-
Expand the uimaj-examples project in the Eclipse Navigator or Package Explorer view
-
Within this project, browse to the file descriptors/tutorial/ex1/RoomNumberAnnotator.xml.
-
Right-click on this file and select Open With →Component Descriptor Editor. (If this option is not present, check to make sure you installed the plug-ins. The EMF plugin is also required.)
-
This should open a graphical editor and display the contents of the RoomNumberAnnotator descriptor.
1.2. Creating a New AE Descriptor
A new AE descriptor file may be created by selecting the File →New →Other… menu. This brings up the following dialog:
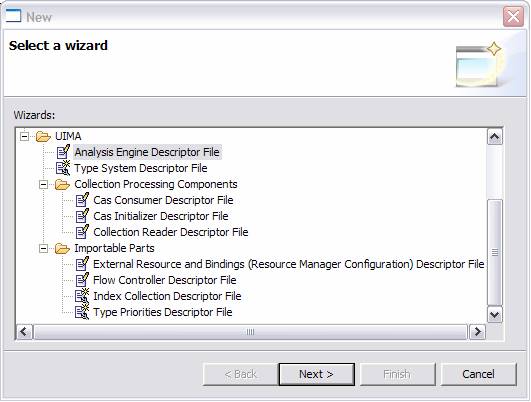
If the user then selects UIMA and Analysis Engine Descriptor File, and clicks the Next button, the following dialog is displayed. We will cover creating other kinds of components later in the documentation.
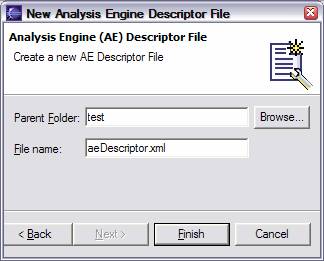
After entering the appropriate parent folder and file name, and clicking Finish, an initial AE descriptor file is created with the given name, and the descriptor is opened up within the Component Descriptor Editor.
At this point, the display inside the Component Descriptor Editor is the same whether one started by creating a new AE descriptor, as in the preceding paragraph, or one merely opened a previously created AE descriptor from, say, the Package Explorer view. We show a previously created AE in the figure below:
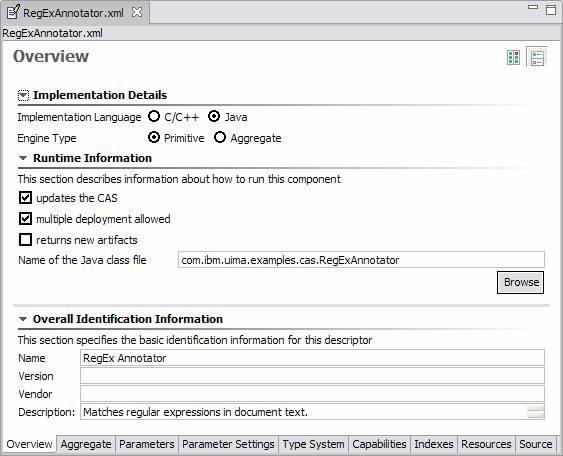
To see all the information shown in the main editor pane with less scrolling, double click the title tab to toggle between the “full screen” and normal views.
It is possible to set the Component Descriptor Editor as the default editor for all .xml files by going to Window →Preferences, and then selecting File Associations on the left, and *.xml on the right, and finally by clicking on Component Descriptor Editor, the Default button and then OK. If AE and Type System descriptors are not the primary .xml files you work with within the Eclipse environment, we recommend not setting the Component Descriptor Editor as your default editor for all .xml files. To open an .xml file using the Component Descriptor Editor, if the Component Descriptor Editor is not set as your default editor, right click on the file in the Package Explorer, or other navigational view, and select Open With →Component Descriptor Editor. This choice is remembered by Eclipse for subsequent open operations.
1.3. Pages within the Editor
The Component Descriptor Editor follows a standard Eclipse paradigm for these kinds of editors. There are several pages in the editor; each one can be selected, one at a time, by clicking on the bottom tabs. The last page contains the actual XML source file being edited, and is displayed as plain text.
The same set of tabs appear at the bottom of each page in the Component Descriptor Editor. The Component Descriptor Editor uses this “multi-page editor” paradigm to give the user a view of conceptually distinct portions of the Descriptor metadata in separate pages. At any point in time the user may click on the Source tab to view the actual XML source. The Component Descriptor Editor is, in a way, just a fancy GUI for editing the XML. The tabs provide quick access to the following pages: Overview, Aggregate, Parameters, Parameter Settings, Type System, Capabilities, Indexes, Resources, and Source. We discuss each of these pages in turn.
1.3.1. Adjusting the display of pages
Most pages in the editor have a “sash” bar. This is a light gray bar which separates sub-sections of the page. This bar can be dragged with the mouse to adjust how the display area is split between the two sash panes. You can also change the orientation of the Sash so it splits vertically, instead of horizontally, by clicking on the small icons at the top right of the page that look like this:

All of the sections on a page have subtitles, with an indicator to the left which you can click to collapse or expand that particular section. Collapsing sections can sometimes be useful to free up screen area for other sections.
1.4. Overview Page
Normally, the first page displayed in the Component Descriptor Editor is the Overview page (the name of the page is shown in the GUI panel at the top left). If there is an error reading and parsing the source, the Source page is shown instead, giving you the opportunity to correct the problem. For many components, the Overview page contains three sections: Implementation Details, Runtime Information and overall Identification Information.
1.4.1. Implementation Details
In the Implementation Details section you specify the Implementation Language and Engine Type. There are two kinds of Engines: Aggregate, and non-Aggregate (also called Primitive). An Aggregate engine is one which is composed of additional component engines and contains no code, itself. Several of the pages in the Component Descriptor Editor have different formats, depending on the engine type.
1.4.2. Runtime Information
Runtime information is only applicable for primitive engines and is disabled for aggregates and other kinds of descriptors. This is where you specify the class name of the annotator implementation, if you are doing a Java implementation, or the C++ shared object or dll name, if you are doing a C++ implementation. Most Analysis Engines will specify that they update the CAS, and that they may be replicated (for performance reasons) when deployed. If a particular Analysis Engine must see every CAS (for instance, if it is counting the number of CASes), then uncheck the “multiple deployment allowed” box. If the Analysis Engine doesn’t update the CAS, uncheck the “updates the CAS” box. (Most CAS Consumers do not update the CAS, and this parameter defaults to unchecked for new CAS Consumer descriptors).
Analysis engines are written using the CAS Multiplier APIs can create additional CASes for analysis.
To specify that they do this, check the returns new artifacts.
1.5. Aggregate Page
For primitive Analysis Engines, Flow Controllers or Collection Processing components, the Aggregate page is not used. For aggregate engines, the page looks like this:
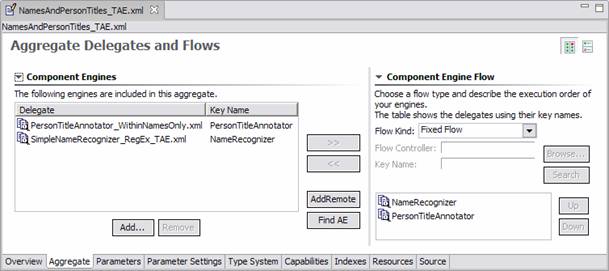
On the left we see a list of component engines, and on the right information about the flow. If you hover the mouse over an item in the list of component engines, that engine’s description meta data will be shown. If you right-click on one of these items, you get an option to open that delegate descriptor in another editor instance. Any changes you make, however, won’t be seen until you close and reopen the editor on the importing file.
Engines can be added to the list on the left by clicking the Add button at the bottom of the Component Engine section. This brings up one of the following two dialogs:
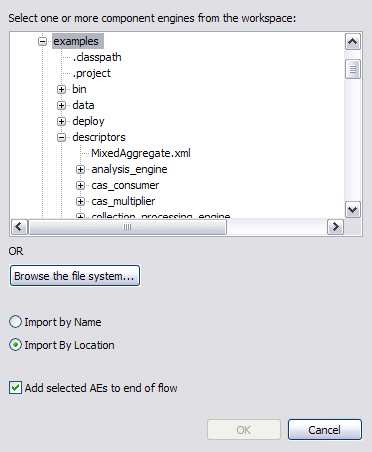
This dialog lets you select a descriptor from your workspace, or browse the file system to select a descriptor.
Or, if you have selected to import by name, this dialog is shown:
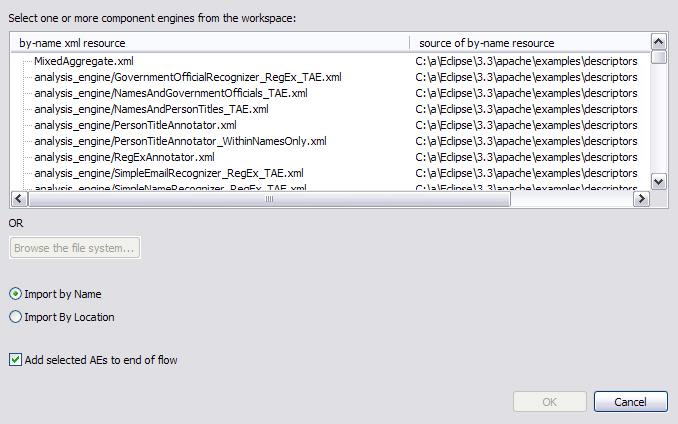
You can specify that the import should be by Name (the name is looked up using both the Project’s class path, and DataPath), or by location.
If it is by name, the dialog shows the available xml files on the class path, to pick from.
If the one you want isn’t showing, this means it isn’t on the enclosing Eclipse Java Project’s classpath, nor on the datapath, and one of those needs to be updated to include the path to the resource.
If the name picked is com/company/prod/xyz.xml, the name in the descriptor will be “`com.company.prod.xyz`”.
The "Browse the file system…" button is disabled when import by name is checked, because the file system is not the source of the imports - rather, its the resources on the classpath or datapath that are.
If it is by location, the file reference is converted to a relative reference if possible, in the descriptor.
The final selection at the bottom tells whether or not the selected engine(s) should automatically be added to the end of the flow section (the right section on the Aggregate page). The OK button does not become activated until a descriptor file is selected.
To remove an analysis engine from the component engine list simply select an engine and click the Remove button, or press the delete key. If the engine is already in the flow list you will be warned that deletion will also delete the specified engine from this list.
1.5.1. Adding components more than once
Components may be added to the left panel more than once. Each of these components will be given a key which is unique. A typical reason this might be done is to use a component in a flow several times, but have each use be associated with different configuration parameters (different configuration parameters can be associated with each instance).
1.5.2. Adding or Removing components in a flow
The button in-between the Component Engines and the Flow List, labeled >>, adds a chosen engine to the flow list and the button labeled << removes an engine from the flow list.
To add an engine to the flow list you must first select an engine from the left hand list, and then press the >> button.
Engines may appear any number of times in the flow list.
To remove an engine from the flow list, select an engine from the right hand list and press the << button.
1.5.3. Adding remote Analysis Engines
There are two ways to add remote engines: add an existing descriptor, which specifies a remote engine (just as if you were adding a non-remote engine) or use the Add Remote button which will create a remote descriptor, save it, and then import it, all in one operation. The Add Remote button enables you to easily specify the information needed to create a remote service descriptor for a remote AE - one that runs on a different computer connected over the network. There are 3 kinds of these: two are variants of the Service Client descriptor; the other is the UIMA-AS JMS Service descriptor, described in the UIMA AS documentation. The Add Remote button creates an instance of one of these descriptors, saves it as a file in the workspace, and imports it into the aggregate.
Of course, if you already have a remote service descriptor, you can add it to the set of delegates using the Add button, just like adding other kinds of analysis engines.
After clicking on Add Remote, the following dialog is displayed:
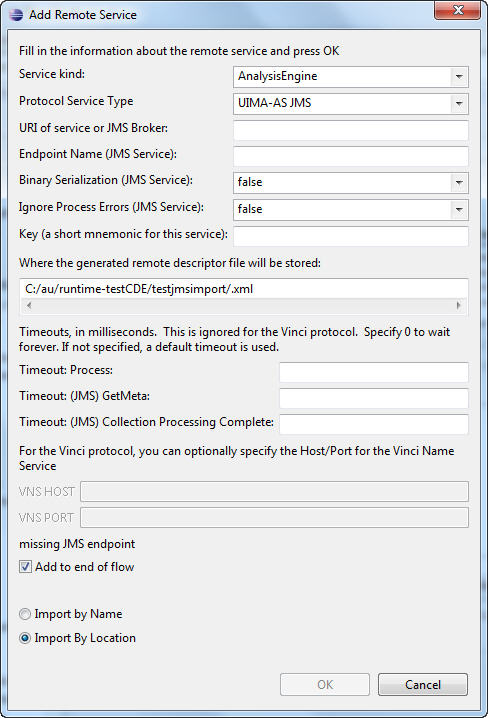
To define a remote service you specify the Service Kind, Protocol Service Type, URI and Key. You can also specify a Timeout in milliseconds, used by the JMS services, and a VNS Host and Port used by the Vinci Service. The JMS service has additional timeouts and other parameters you may specify. Just like when one adds an engine from the file system, you have the option of adding the engine to the end of the flow. The Component Descriptor Editor currently only supports Vinci services using this dialog.
Remote engines are added to the descriptor using the <import … > syntax.
The information you specify here is saved in the Eclipse project as a file, using a generated name, <key-name>.xml, where <key-name> is the name you listed as the Key.
Because of this, the key-name must be a valid file name.
If you want a different name, you can change the path information in the dialog box.
1.5.4. Connecting to Remote Services
If you are using the Vinci protocol, it requires that you specify the location of the Vinci Name Server (an IP address and a Port number). You can specify these in the service descriptor, or globally, for your Eclipse workspace, using the Eclipse menu item: Window →Preferences… →UIMA Preferences.
If the remote service is available (up and running), additional operations become possible. For instance, hovering the mouse over the remote descriptor will show the description metadata from the remote service.
1.5.5. Finding Analysis Engines by searching
The next button that appears between the component engine list and the flow list is the Find AE button. When this button is pressed the following dialog is displayed, which allows one to search for AEs by name, by input or output types, or by a combination of these criteria. This function searches the existing Eclipse workspace for matching *.xml descriptor source files; it does not look inside Jar files.
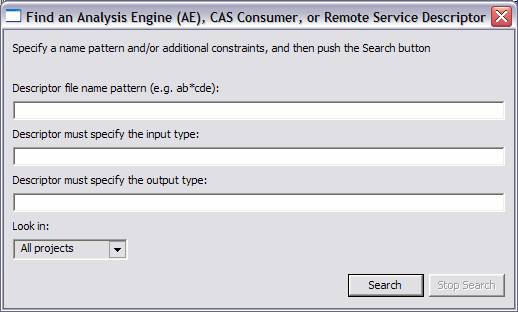
The search automatically adds a “match any characters” - style () wildcard at the beginning and end of anything entered. Thus, if person is specified for an output type, a “*person” search is performed. Such a search would match such things as “my.namespace.person” and “person.governmentOfficial.” One can search in all projects or one particular project. The search does an implicit and on all fields which are left non-blank.
1.5.6. Component Engine Flow
The UIMA SDK currently supports three kinds of sequencing flows: Fixed, CapabilityLanguageFlow, and user-defined. The first two require specification of a linear flow sequence; this linear flow sequence can also be read by a user-defined flow controller (what use is made of it is up to the user-defined flow controller). The Component Engine Flow section allows specification of these items.
The pull-down labeled Flow Kind picks between the three flow models. When the user-defined flow is selected, the Browse and Search buttons become enabled to let you pick the flow controller XML descriptor to import.
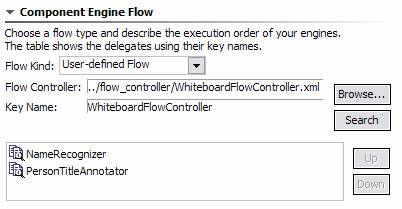
The key name value is set automatically from the XML descriptor being imported, and enables parameters to be overridden for that descriptor (see following sections).
The Up and Down buttons to the right in the Flow section are activated when an engine in the flow is selected. The Up button moves the selected engine up one place in the execution order, and down moves the selected engine down one place in the execution order. Remember that engines can appear multiple times in the flow (or not at all).
1.6. Parameters Definition Page
There are two pages for parameters: the first one is where parameters are defined, and the second one is where the parameter settings are configured. The first page is the Parameter Definition page and has two alternatives, depending on whether or not the descriptor is an Aggregate or not. We start with a description of parameter definitions for Primitive engines, CAS Consumers, Collection Readers, CAS Initializers, and Flow Controllers. Here is an example:
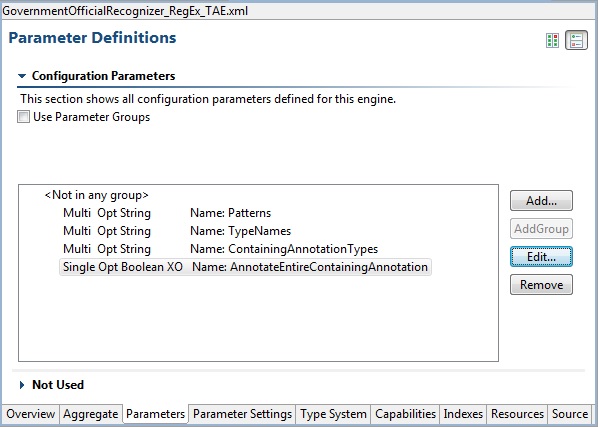
The first checkbox at the top simplifies things if you are not using Parameter Groups (see the following section for a discussion of groups). In this case, leave the check box unchecked. The main area shows a list of parameter definitions. Each parameter has a name, which must be unique for this Analysis Engine. The first three attributes specify whether the parameter can have a single or multiple values (an array of values), whether it is Optional or Mandatory, and what the value type it can hold (String, Integer, Float, and Boolean). If an external override name has been specified an attribute of "XO" is included. See External Configuration Parameter Overrides for a discussion of external configuration parameter overrides.
In addition to using the buttons on the right to edit this information, you can double-click a parameter to edit it, or remove (delete) a selected parameter by pressing the delete key. Use the Add button to add a new parameter to the list.
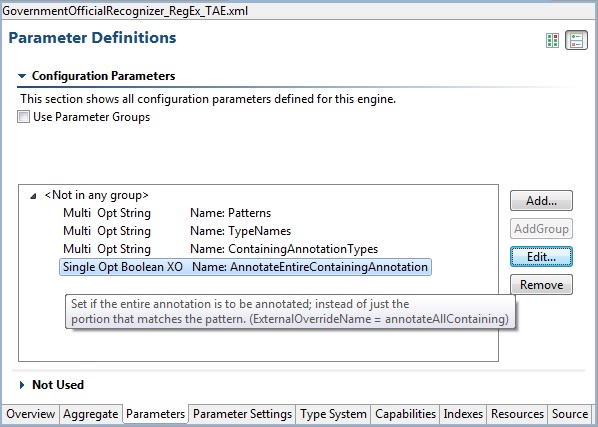
Parameters have an additional description field, which you can specify when you add or edit a parameter. To see the value of the description, hover the mouse over the item, as shown in the picture below. If the parameter has an external override name its value is included in the hover.
1.6.1. Using groups
The group concept for parameters arose from the observation that sets of parameters were sometimes associated with different configuration needs. As an example, you might have an Analysis Engine which needed different configuration based on the language of a document.
To use groups, you check the “Use Parameter Groups” box. When you do this, you get the ability to add groups, and to define parameters within these groups. You also get a capability to define “Common” parameters, which are parameters which are defined for all groups. Here is a screen shot showing some parameter groups in use:
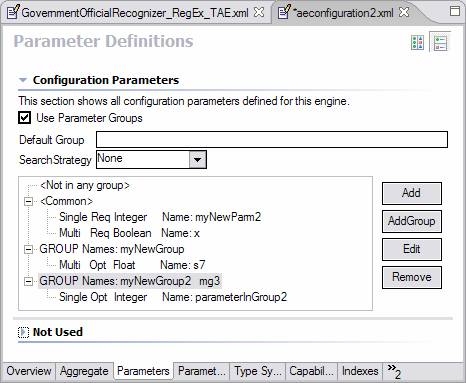
You can see the <Common> parameters as well as two different sets of groups.
The Default Group is an optional specification of what Group to use if the parameter is not available for the group requested.
The Search strategy specifies what to do when a parameter is not available for the group requested.
It can have the values of None, language_fallback, or default_fallback.
Groups are added using the Add Group button.
Once added, they can be edited or removed, using the buttons to the right, or the standard gestures for editing (double-clicking the item) and removing (pressing the delete key after an item is selected). Removing a group removes all the parameter definitions in the group.
If you try and remove the <Common> group, it just removes the parameters in the group.
Each entry for a group in the table specifies one or more group names.
For example, the highlighted entry above, specifies two groups: myNewGroup2 and mg3.
The parameter definition underneath is considered to be in both groups.
1.6.2. Adding or Editing a Parameter
When creating or modifying a parameter both a unique name and a valid type must be specified. The Description and External Override fields are optional. The defaults for the two checkboxs indicate a single-valued optional parameter in the example below:
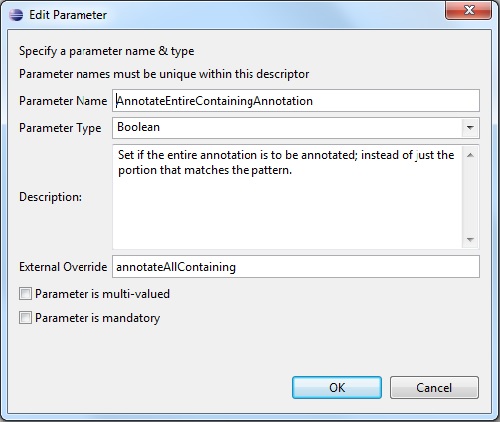
1.6.3. Parameter declarations for Aggregates
Aggregates declare parameters which always must override a parameter setting for a component making up the aggregate. They do this using the version of this page which is shown when the descriptor is an Aggregate; here’s an example:
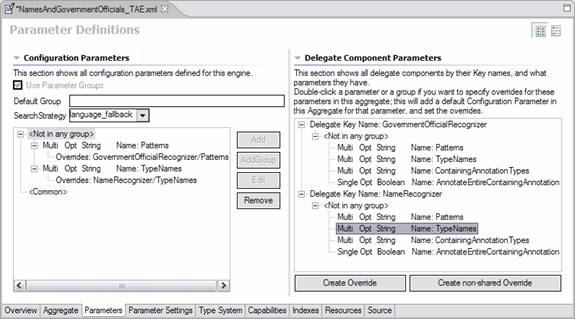
There is an additional panel shown (on the right) which lists all of the components by their key names, and shows for each of them their defined parameters. To add a new override for one or more of these parameters to the aggregate, select the component parameter you wish to override and push the Create Override button (or, you can just double-click the component parameter). This will automatically add a parameter of the same name (by default –you can change the name if you like) to the aggregate, putting it into the same group(s) (if groups are being used in the component –this is required), and setting the properties of the parameter to match those of the component (this is required).
|
Note
|
If the name of the parameter being added already is in use in the aggregate, and the parameters are not compatible, a new parameter name is generated by suffixing the name with a number. If the parameters are compatible, the selected component parameter is added to the existing aggregate parameter, as an additional override. If you don’t want this behavior, but want to have a new name generated in this case, push the Create non-shared Override button instead, or hold down the “shift” key when double clicking the component parameter. The required / optional setting in the aggregate parameter is set to match that of the parameter being overridden. You may want to make an optional delegate parameter required. You can do this by changing that value manually in the source editor view. |
In the above example, the user has just double-clicked the TypeNames parameter in the NameRecognizer component.
This added that parameter to this aggregate under the <Not in any group> section — since it wasn’t part of a group.
Once you have added a parameter definition to the aggregate, you can use the buttons on the right side of the left panel to add additional overrides or remove parameters or their overrides. You can also remove groups; removing a group is like removing all the parameter definitions in the group.
In addition to adding one parameter at a time from a component, you can also add all the parameters for a group within a component, or all the parameters in the component, by selecting those items.
If you double-click (or push Create Override) the <Common> group or a parameter in the <Common> group in a component, a special group is created in the Aggregate consisting of all of the groups in that component, and the overriding parameter (or parameters) are added to that.
This is done because each component can have different groups belonging to the Common group notion; the Common group for a component is just shorthand for all the groups in that component.
The Aggregate’s specification of the default group and search strategy override any specifications contained in the components.
1.7. Parameter Settings Page
The Parameter Settings page is rather straightforward; it is where the user defines parameter settings for their engines. An example of such a page is given below:
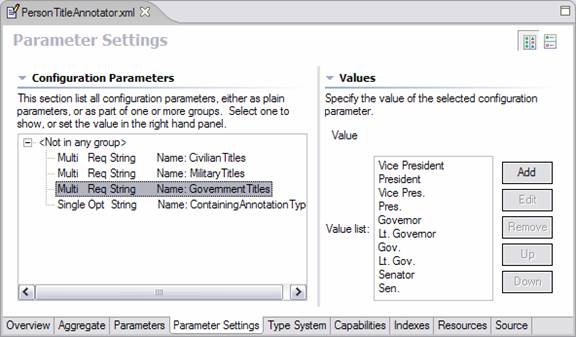
For single valued attributes, the user simply types the default value into the Value box on the right hand side. For multi-valued parameters the user should use the Add, Edit and Remove buttons to manage the list of multiple parameter values.
Values within groups are shown with each group separately displayed, to allow configuring different values for each group.
Values are checked for validity.
For Boolean values in a list, use the words true or false.
|
Note
|
If you specify a value in a single-valued parameter, and then delete all the characters in the value, the CDE will treat this as if you wanted to not specify any setting for this parameter. In order to specify a 0 length string setting for a String-valued parameter, you will have to manually edit the XML using the “Source” tab. For array valued parameters, if you remove all of the entries for a particular array parameter setting, the XML will reflect a 0-length array. To change this to an unspecified parameter setting, you will have to manually edit the XML using the “Source” tab. |
1.8. Type System Page
This page declares the type system used by the annotator. For aggregates it is derived by merging the type systems of all constituent AEs. The types used by the AE constitute the language in which the inputs and outputs are described in the Capabilities page and also affect the choice of indexes on the Indexes page. The Type System page looks like the following:
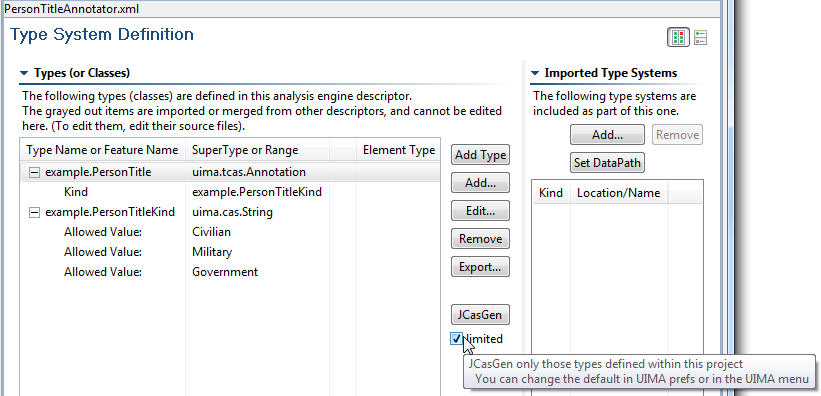
Before discussing this page in detail, it is important to note that there are 3 settings that affect the operation of this page. These are accessed by selecting the UIMA →Settings (or by going to the Eclipse Window →Preferences →UIMA Preferences) and checking or unchecking one of the following: “Auto generate .java files when defining types”, “Generate JCasGen classes only for types defined within the local project scope” and “Display fully qualified type names.”
When the Auto generate option is checked and the development language for the AE is Java, any time a change is made to a type and the change is saved, the corresponding .java files are generated using the JCasGen tool. The results are stored in the primary source directory defined for the project. The primary source directory is that listed first when you right click on your project and select Properties →Java Build Path, click on the Source tab and look in the list box under the text that reads: Source folder on build path. If no source folders are defined, you will get a warning that you have no source folders defined and JCasGen will not be run. When JCasGen is run, you can monitor the progress of the generation by observing the status on the Eclipse status line (normally at the bottom of the Eclipse window). JCasGen runs on the fully-merged type system, consisting of the type specification plus any imported type system, plus (for aggregates) the merged type systems of all the components in an aggregate.
|
Warning
|
If the components of the aggregate have different definitions for the same type name, the CDE will show a warning. It is possible to continue past this warning, in which case the CDE will produce the correct Java source files representing the merged types (that is, the type definition that contains all of the features defined on that type by all of your components). However, it is not recommended to use this feature (of having different definitions for the same type name) since it can make it difficult to combine/package your annotator with others. |
|
Note
|
In addition to running automatically, you can manually run JCasGen on the fully merged type system by clicking the JCasGen button, or by selecting Run JCasGen from the UIMA pulldown menu: |

When Generate JCasGen classes only for types defined within the local project scope is checked, then JCasGen skips generating classes for types that are imported from sources outside this project. This might be done, for instance, if you have an aggregate which is importing type systems from its delegates, some of which are defined in other projects, and have JCasGen’d files already present in those other projects.
The UIMA settings and preferences for controlling this are used to initialize a particular instance of the editor, when it is started. Following that, you can override this setting, just for that editor, by checking or unchecking the box shown on the type system page:

|
Note
|
If this is checked, and one of the types that would be excluded has merged type features, an error message is issued - because JCasGen will need to be run for the combined (merged) type in order to get a class definition that will work for this configuration (have access to all the features). If this happens, you have to run without limiting JCasGen, and manually delete any duplicated/unwanted source results. |
When Display fully qualified type names is left unchecked, the namespace of types is not displayed, i.e. if a fully qualified type name is my.namespace.person, only the abbreviated type name person will be displayed. In the Type page diagram shown above, Display fully qualified type names is in fact unchecked.
To add, edit, or remove types the buttons on the top left section are used. When adding or editing types, fully qualified type names should of course be used, regardless of whether the Display fully qualified type names is unchecked. Removing or editing a type will have a cascading effect in that the type removal/edit will effect inputs, outputs, indexes and type priorities in the natural way.
When a type is added, this dialog is shown:
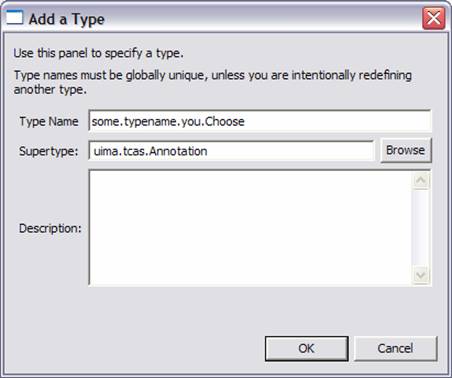
Type names should be specified using a namespace. The namespace is like a Java package name, and serves to insure type names are unique. It also serves as the package name for the generated JCas classes. The namespace name is the set of names up to the last period in the string.
The supertype must be picked from an existing type. The entry field for the supertype supports Eclipse-style content assist. To use it, put the cursor in the supertype field, and type a letter or two of the supertype name (lower case is fine), either starting with the name space, or just with the type name (without the name space), and hold down the Control key and then press the spacebar. When you do this, you can see a list of suitable matching types. You can then type more letters to narrow down your choices, or pick the right entry with the mouse.
To see the available types and pick one, press the Browse button. This will show the available types, and as you type letters for the type name (in lower case –capitalization is ignored), the available types that match are narrowed. When you’ve typed enough to specify the type you want, press Enter. Or you can use the list of matching type names and pick the one you want with the mouse.
Once you’ve added the type, you can add features to it by highlighting the type, and pressing the Add button.
If the type being defined is a subtype of uima.cas.String, the Add button allows you to add allowed values for the string, instead of adding features.
To edit a type or feature, you can double click the entry, or highlight the entry and press the Edit button. To delete a type or feature, you highlight the entry to be deleted, and click the delete button or push the delete key.
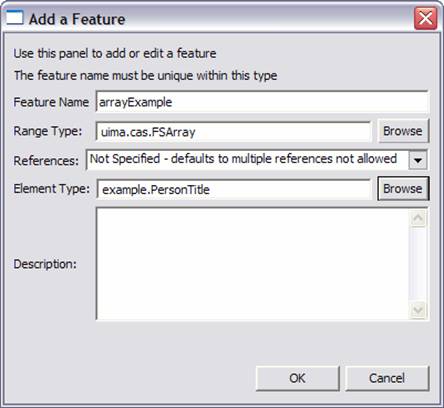
If the range of a feature is an array or one of the built-in list types, an additional specification allows you to specify if multiple references to the object referenced by this feature are allowed. If they are not allowed then the XMI serialization of instances of this type use a more efficient format.
If the range of a feature is an array of Feature Structures, then it is possible to specify an element type for the array. This information is used in the XMI serialization and also by the JCas generation routines to generate more efficient code.
It is also possible to import type systems for inclusion in your descriptor. To do this, use the Type Import panel’s Add… button. This allows you to import a type system descriptor.
When importing by name, the name is resolved using the class path for the Eclipse project containing the descriptor file being edited, or by looking up this name in the UIMA DataPath. The DataPath can be set by pushing the Set DataPath button. It will be remembered for this Eclipse project, as a project Property, so you only have to set it once (per project). The value of the DataPath setting is written just like a class path, and can include directories or JAR files, just as is true for class paths.
The following dialog allows you to pick one or more files from the Eclipse workspace, or one file (at a time) from the file system:
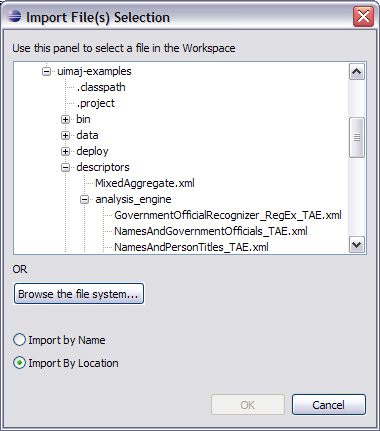
This is essentially the same dialog as was used to add component engines to an aggregate. To import from a type system descriptor that is not part of your Eclipse workspace, click the Browse the file system… button.
Imported types are validated, and if OK, they are added to the list in the Imported Type Systems section of the Type System page. Any types they define are merged with the existing type system.
Imported types and features which are only defined in imports are shown in the Type System section, but in a grayed-out font; these type cannot be edited here. To change them, open up the imported type system descriptor, and change them there.
If you hover the mouse over an import specification, it will show more information about the import. If you right-click, it will bring up a context menu that allows opening the imported file in the Editor, if the imported file is part of the Eclipse workspace. Changes you make, however, won’t be seen until you close and reopen the editor on the importing file.
It is not possible to define types for an aggregate analysis engine. In this case the type system is computed from the component AEs. The Type System information is shown in a grayed-out font.
1.8.1. Exporting
In addition to importing type specifications, you can export as well. When you push the Export… button, the editor will create a new importable XML descriptor for the types in this type system, and change the existing descriptor to import that newly created one.
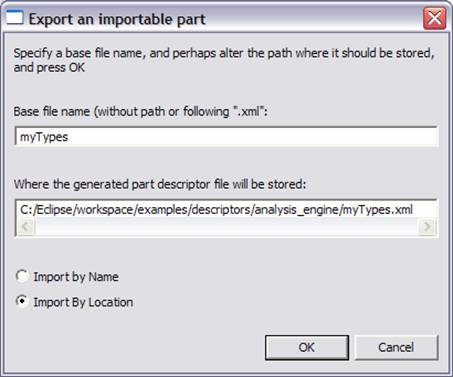
The base file name you type is inserted into the path in the line below automatically. You can change the path where the generated part descriptor is stored by overtyping the lower text box. When you click OK, the new part descriptor will be generated, and the current descriptor will be changed to import that part.
1.9. Capabilities Page
Capabilities come in sets. You can have multiple sets of capabilities; each one specifies languages supported, plus inputs and outputs of the Analysis Engine. The idea behind having multiple sets is the concept that different inputs can result in different outputs. Many Analysis Engines, though, will probably define just one set of capabilities. A sample Capabilities page is given below:
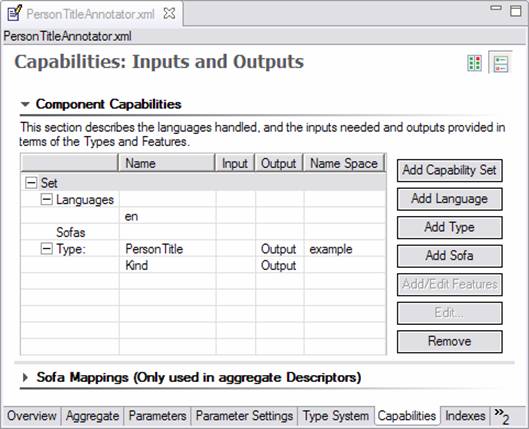
When defining the capabilities of a primitive analysis engine, input and output types can be any type defined in the type system. When defining the capabilities of an aggregate the inputs must be a subset of the union of the inputs in the constituent analysis engines and the outputs must be a subset of the union of the outputs of the constituent analysis engines.
To add a type, first select something in the set you wish to add the type to, and press Add Type. The following dialog appears presenting the user with a list of types which are candidates for additional inputs:
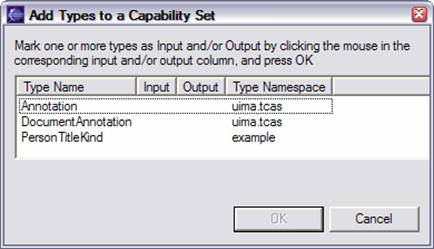
Follow the instructions to mark the types as input and / or output (a type can be both). By default, the <all features> flag is set to true. If you want to specify a subset of features of a type, read on.
When types have features, you can specify what features are input and / or output. A type doesn’t have to be an output to have an output feature. For example, an Analysis Engine might be passed as input a type Token, and it adds (outputs) a feature to the existing Token types. If no new Token instances were created, it would not be an output Type, but it would have features which are output.
To specify features as input and / or output (they can be both), select a type, and press Add. The following dialog box appears:
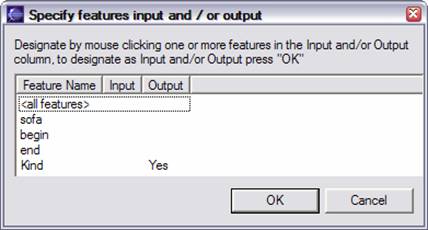
To mark a feature as being input and / or output, click the mouse in the input and / or output column for the feature. If you select <all features>, it unmarks any individual feature you selected, since <all features> subsumes all the features.
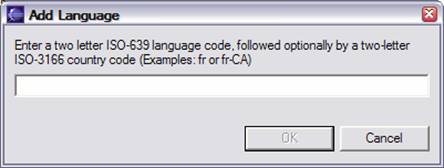
The Languages part of the capability is where you specify what languages are supported by the Analysis Engine. Supported languages should be listed using either a two letter ISO-639 language code, or an ISO-639 language code followed by a hyphen and then a two-letter ISO-3166 country code. Add a language by selecting Languages and pressing the Add button. The dialog for adding languages is given below.
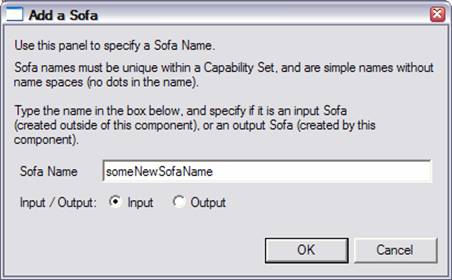
The Sofa part of the capability is optional; it allows defining Sofa names that this component uses, and whether they are input (meaning they are created outside of this component, and passed into it), or output (meaning that they are created by this component). Note that a Sofa can be either input or output, but can’t be both.
To add a Sofa name (which is synonymous with the view name), press the Add Sofa button, and this dialog appears:
1.9.1. Sofa (and view) name mappings
Sofa names, once created, are used in Sofa Mappings. These are optional mappings, done in an aggregate, that specify which Sofas are the same ones but with different names. The Sofa Mappings section is minimized unless you are editing an Aggregate descriptor, and have one or more Sofa names defined for the aggregate. In that case, the Sofa Mappings section will look like this:
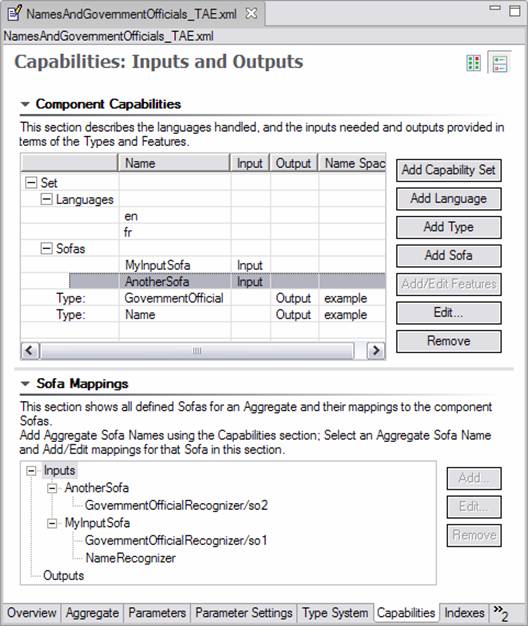
Here the aggregate has defined two input Sofas, named “MyInputSofa”, and “AnotherSofa”. Any named sofas in the aggregate’s capabilities will appear in the Sofa Mapping section, listed either under Inputs or Outputs. Each name in the Mappings has 0 or more delegate (component) sofa names mapped to it. A delegate may have multiple Sofas, as in this example, where the GovernmentOfficialRecognizer delegate has Sofas named “so1” and “so2”.
Delegate components may be written as Single-View components. In this case, they have one implicit, default Sofa (“_InitialView”), and to map to it you use the form shown for the “NameRecognizer”– you map to the delegate’s key name in the aggregate, without specifying a Sofa name. You can also specify the sofa name explicitly, e.g., NameRecognizer/_InitialView.
To add a new mapping, select the Aggregate Sofa name you wish to add the mapping for, and press the Add button. This brings up a window like this, showing all available delegates and their Sofas; select one or more (use the normal multi-select methods) of these and press OK to add them.
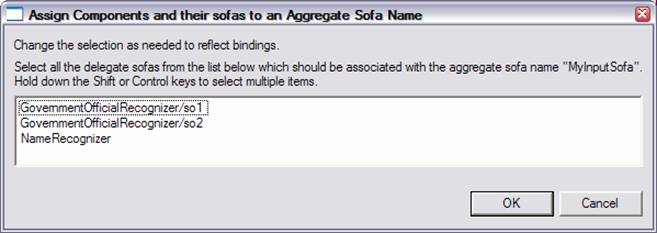
To edit an existing mapping, select the mapping and press Edit. This will show the existing mapping with all mapped items “selected”, and other available items unselected. Change the items selected to match what you want, deselecting some, and perhaps selecting others, and press OK.
1.10. Indexes Page
The Indexes page is where the user declares what indexes and type priority lists are used by the analysis engine. Indexes are used to determine which Feature Structures of a particular type are fetched, using an iterator in the UIMA API. An unpopulated Indexes page is displayed below:
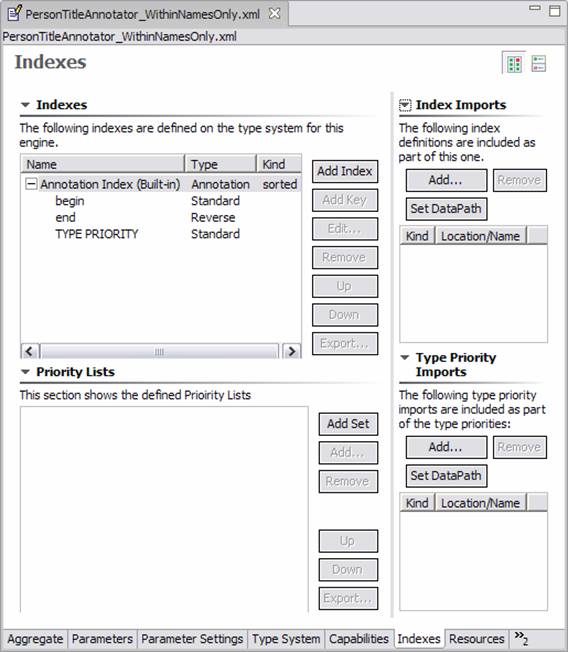
Both indexes and type priority lists can have imports. These imports work just like the type system imports, described above. Both indexes and type priority lists can be exported to new component descriptors, using the Export… button, just like the type system export operation described above.
The built-in Annotation Index is always present.
It is based on the built-in type uima.tcas.Annotation and has keys begin (Ascending), end (Descending) and TYPE_PRIORITY.
There are no built-in type priorities, so this last sort item does not play a role in the index unless type priorities are specified.
Type priority may be combined with other keys. Type priorities are defined in the Priority Lists section, using one or more priority list. A given priority list gives an ordering among a group of types. Types that appear higher in the priority list are given higher priority, in other words, they sort first when TYPE_PRIORITY is specified as the index key. Subtypes of these types are also ordered in a consistent manner, unless overridden by another specific type priority specification. To get the ordering used among all the types, all of the type priority lists are merged. This gives a partial ordering among the types. Ties are resolved in an unspecified fashion. The Component Descriptor Editor checks for incompatible orderings, and informs the user if they exist, so they can be corrected.
To create a new index, use the Add Index button in the top left section. This brings up this dialog:
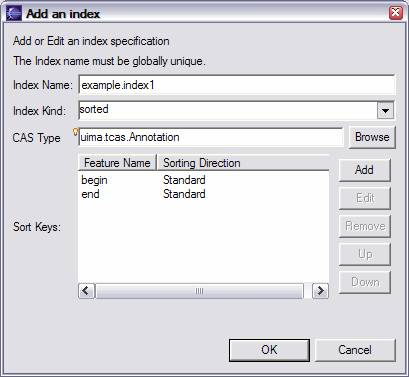
Each index needs a globally unique index name. Every index indexes one CAS type (including its subtypes). If you’re using Eclipse 3.2 or later, the entry field for this has content assist (start typing the type name and press Control –Spacebar to get help, or press the Browse button to pick a type).
Indexes can be sorted, in which case you need to specify one or more keys to sort on. Sort keys are selected from features whose range type is Integer, Float, or String. Some elements will be disabled if they are not relevant. For instance, if the index kind is “bag”, you cannot provide sort keys. The order of sort keys can be adjusted using the up and down buttons, if necessary.
|
Note
|
There is usually no need to explicitly declare a Bag index in your descriptor.
As of UIMA v2.1, if you do not declare any index for a type (or any of its supertypes), a Bag index will be automatically created.
This index is accessed using the |
A set index will contain no duplicates of the same type, where a duplicate is defined by the indexing comparator. That is, if you commit two feature structures of the same type that are equal with respect to the indexing comparator, only the first one will be entered into the index. Note that you can still have duplicates with respect to the indexing order, if they are of a different type. A set index is not guaranteed to be sorted. If no keys are specified for a set index, then all instances are considered by default to be equal, so only the first instance (for a particular type or subtype of the type being indexed) is indexed. On the other hand, “bag” indicates that all annotation instances are indexed, including duplicates.
The Priority Lists section of the Indexes page is used to specify Priority Lists of types. Priority Lists are unnamed ordered sets of type names. Add a new priority list by clicking the Add Set button. Add a type to an existing priority list by first selecting the set, and then clicking Add. You can use the up and down buttons to adjust the order as necessary; these buttons move the selected item up or down.
Although it is possible to import self-contained index and type priority files, the creation of such files is not yet supported by the Component Descriptor Editor. If you create these files using another editor, they can be imported using the corresponding Import panels, shown on the right. Imports are specified in the same manner as they are for Type System imports.
1.11. Resources Page
The resources page describes resource dependencies (for primitive Analysis Engines) and external Resource specification and their bindings to the resource dependencies.
Only primitive Analysis Engines define resource dependencies. Primitive and Aggregate Analysis Engines can define external resources and connect them (bind them) to resource dependencies.
When an Aggregate is providing an external resource to be bound to a dependency, the binding is specified using a possibly multi-level path, starting at the Aggregate, and specify which component (by its key name), and then if that component is, in turn, an Aggregate, which component (again by its key name), and so on until you reach a primitive. The sequence of key names is made into the binding specification by joining the parts with a “/” character. All of this is done for you by the Component Descriptor Editor.
Any external resource provided by an Aggregate will override any binding provided by any lower level component for the same resource dependency.
There are two views of the Resources page, depending on whether the Analysis Engine is an Aggregate or Primitive. Here’s the view for a Primitive:
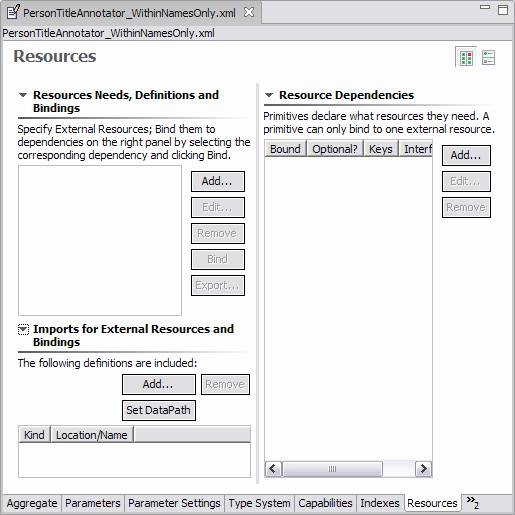
To declare a resource dependency, click the Add button in the right hand panel. This puts up the dialog:
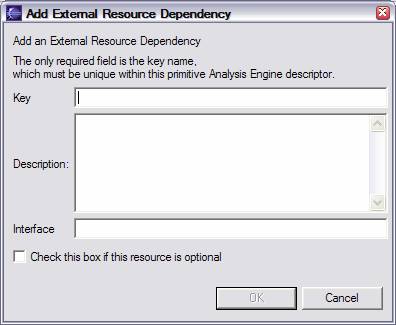
The Key must be unique within the descriptor declaring it. The Interface, if present, is the name of a Java interface the Analysis Engine uses to access the resource.
Declare actual External resource on the left side of the page. Clicking Add brings up this dialog:
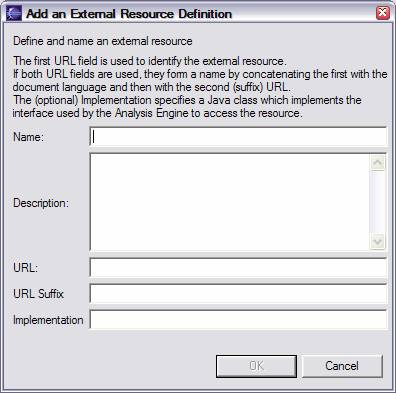
The Name must be unique within this Analysis Engine.
The URL identifies a file resource.
If both the URL and URL suffix are used, the file resource is formed by combining the first URL part with the language-identifier, followed by the URL suffix; see Resource Manager Configuration.
URLs may be written as relative URLs; in this case they are resolved by looking them up relative to the classpath and/or datapath.
A relative URL has the path part starting without an intial “/”; for example: file:my/directory/file.
An absolute URL starts with file:/ or file:/// or file://some.network.address/. For more information about URLs, please read the javaDoc information for the Java class URL.
The Implementation is optional, and if given, must be a Java class that implements the interface specified in any Resource Dependencies this resource is bound to.
1.11.1. Binding
Once you have an external resource definition, and a Resource Dependency, you can bind them together. To do this, you select the two things (an external resource definition, and a Resource Dependency) that you want to bind together, and click Bind.
1.11.2. Resources with Aggregates
When editing an Aggregate Descriptor, the Resource definitions panel will show all the resources at the primitive level, with paths down through the components (multiple levels, if needed) to get to the primitives. The Aggregate can define external resources, and bind them to one or more uses by the primitives.
1.11.3. Imports and Exports
Resource definitions and their bindings can be imported, just like other imports. Existing Resource definitions and their bindings can be exported to a new importable part, and replaced with an import for that importable part, using the “Export…” button, just like the similar function on the Type System page.
1.12. Source Page
The Source page is a text view of the xml content of the Analysis Engine or Type System being configured. An example of this page is displayed below:
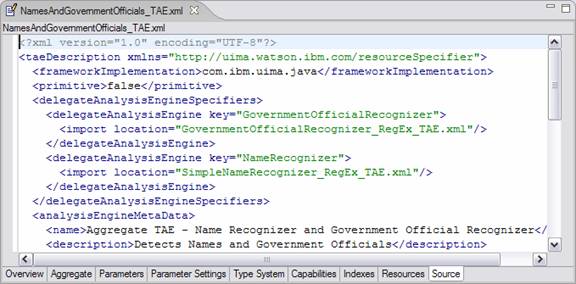
Changes made in the GUI are immediately reflected in the xml source, and changes made in the xml source are immediately reflected back in the GUI. The thought here is that the GUI view and the Source view are just two ways of looking at the same data. When the data is in an unsaved state the file name is prefaced with an asterisk in the currently selected file tab in the editor pane inside Eclipse (as in the example above).
You may accidentally create invalid descriptors or XML by editing directly in the Source view. If you do this, when you try and save or when you switch to a different view, the error will be detected and reported. In the case of saving, the file will be saved, even if it is in an error state.
1.13. Creating a Self-Contained Type System
It is also possible to use the Component Descriptor Editor to create or edit self-contained type systems. To create a self-contained type system, select the menu item File →New →Other and then select Type System Descriptor File. From the next page of the selection wizard specify a Parent Folder and File name and click Finish.
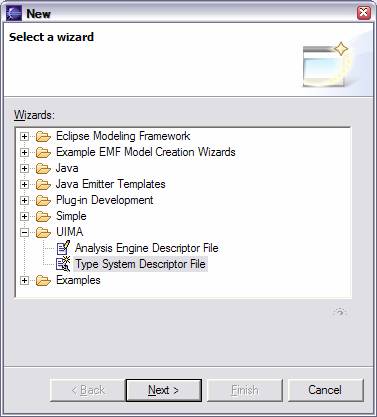
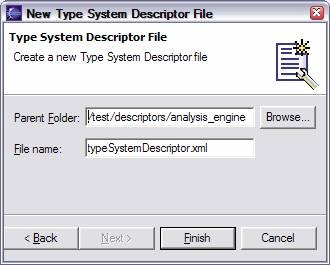
This will take you to a version of the Component Descriptor Editor for editing a type system file which contains just three pages: an overview page, a type system page, and a source page. The overview page is a bit more spartan than in the case of an AE. It looks like the following:
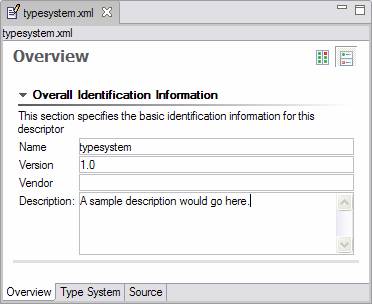
Just like an AE has an associated name, version, vendor and description, the same is true of a self-contained type system. The Type System page is identical to that in an AE descriptor file, as is the Source page. Note that a self-contained type system can import type systems just like the type system associated with an AE.
A type system component can also be created from an existing descriptor which contains a type system definition section, by clicking on the Export… button on the Type System page.
1.14. Creating Other Descriptor Components
The new wizard can create several other kinds of components: Collection Processing Management (CPM) components, flow controllers, and importable parts (besides Type Systems, described above, Indexes, Type Priorities, and Resource Manager Configuration imports).
The CPM components supported by this editor include the Collection Reader, CAS Initializer, and CAS Consumer descriptors. Each of these is basically treated just like a primitive AE descriptor, with small changes to accommodate the different semantics. For instance, a CAS Consumer can’t declare in its capabilities section that it outputs types or features.
Flow controllers are components that control the flow of CASes within an aggregate, an are edited in a similar fashion as a primitive Analysis Engine.
The importable part support requires context information to enable the editor to work, because much of the power of this editor comes from extensive checking that requires additional information, other than what is available in just the importable part. For instance, when you create or edit an Indexes import, the facility for adding new indexes needs the type information, which is not present in this part when it is edited alone.
To overcome this, when you edit these descriptors, you will be asked to specify a context descriptor, usually a descriptor which would import the part being edited, which would have the additional information needed.
Various methods are used to guess what the context descriptor should be - and if the guess is correct, you can just press the Enter key to confirm. The last successful context file is remembered and will be suggested as the context file to use at the next edit session
2. Collection Processing Engine Configurator User’s Guide
A Collection Processing Engine (CPE) processes collections of artifacts (documents) through the combination of the following components: a Collection Reader, Analysis Engines, and CAS Consumers. [1]
The Collection Processing Engine Configurator(CPE Configurator) is a graphical tool that allows you to assemble and run CPEs.
For an introduction to Collection Processing Engine concepts, including developing the components that make up a CPE, read Collection Processing Engine Developer’s Guide. This chapter is a user’s guide for using the CPE Configurator tool, and does not describe UIMA’s Collection Processing Architecture itself.
2.1. Limitations of the CPE Configurator
The CPE Configurator only supports basic CPE configurations.
It only supports “Integrated” deployments (although it will connect to remotes if particular CAS Processors are specified with remote service descriptors). It doesn’t support configuration of the error handling. It doesn’t support Sofa Mappings; it assumes all Single-View components are operating with the _InitialView Sofa. Multi-View components will not have their names mapped. It sets up a fixed-sized CAS Pool.
To set these additional options, you must edit the CPE Descriptor XML file directly. You may then open the CPE Descriptor in the CPE Configurator and run it. The changes you applied to the CPE Descriptor will be respected, although you will not be able to see them or edit them from the GUI.
2.2. Starting the CPE Configurator
The CPE Configurator tool can be run using the cpeGui shell script, which is located in the bin directory of the UIMA SDK.
If you’ve installed the example Eclipse project, you can also run it using the UIMA CPE GUI run configuration provided in that project.
|
Note
|
If you are planning to build a CPE using components other than the examples included in the UIMA SDK, you will first need to update your CLASSPATH environment variable to include the classes needed by these components. |
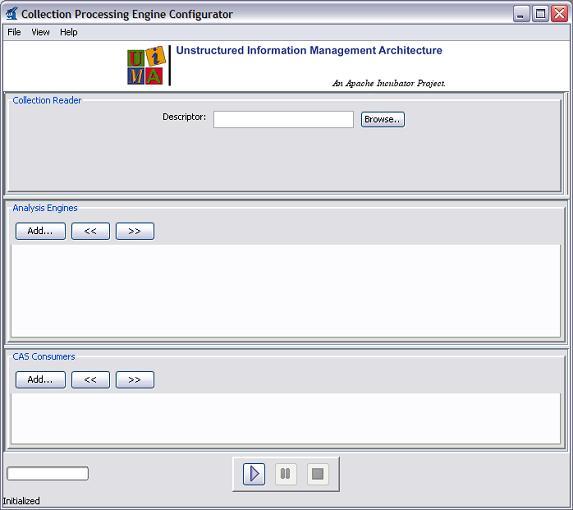
When you first start the CPE Configurator, you will see the main window shown here:
2.3. Selecting Component Descriptors
The CPE Configurator’s main window is divided into three sections, one each for the Collection Reader, Analysis Engines, and CAS Consumers.[2]
In each section of the CPE Configurator, you can select the component(s) you want to use by browsing to (or typing the location of) their XML descriptors. You must select a Collection Reader, and at least one Analysis Engine or CAS Consumer.
When you select a descriptor, the configuration parameters that are defined in that descriptor will then be displayed in the GUI; these can be modified to override the values present in the descriptor.
For example, the screen shot below shows the CPE Configurator after the following components have been chosen:
examples/descriptors/collectionReader/FileSystemCollectionReader.xml
examples/descriptors/analysis_engine/NamesAndPersonTitles_TAE.xml
examples/descriptors/cas_consumer/XmiWriterCasConsumer.xml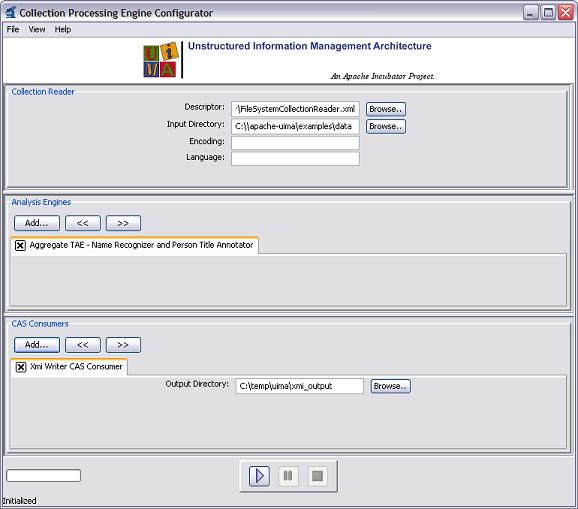
2.4. Running a Collection Processing Engine
After selecting each of the components and providing configuration settings, click the play (forward arrow) button at the bottom of the screen to begin processing. A progress bar should be displayed in the lower left corner. (Note that the progress bar will not begin to move until all components have completed their initialization, which may take several seconds.) Once processing has begun, the pause and stop buttons become enabled.
If an error occurs, you will be informed by an error dialog. If processing completes successfully, you will be presented with a performance report.
2.5. The File Menu
The CPE Configurator’s File Menu has the following options:
-
Open CPE Descriptor
-
Save CPE Descriptor
-
Save Options (submenu)
-
Refresh Descriptors from File System
-
Clear All
-
Exit
Open CPE Descriptor will allow you to select a CPE Descriptor file from disk, and will read in that CPE Descriptor and configure the GUI appropriately.
Save CPE Descriptor will create a CPE Descriptor file that defines the CPE you have constructed. This CPE Descriptor will identify the components that constitute the CPE, as well as the configuration settings you have specified for each of these components. Later, you can use “Open CPE Descriptor” to restore the CPE Configurator to the state. Also, CPE Descriptors can be used to easily run a CPE from a Java program.
CPE Descriptors also allow specifying operational parameters, such as error handling options that are not currently available for configuration through the CPE Configurator. For more information on manually creating a CPE Descriptor, see Collection Processing Engine Descriptor Reference.
The Save Options submenu has one item, Use <import>`.
If this item is checked (the default), saved CPE descriptors will use the `<import> syntax to refer to their component descriptors.
If unchecked, the older <include> syntax will be used for new components that you add to your CPE using the GUI.
(However, if you open a CPE descriptor that used <import>, these imports will not be replaced.)
Refresh Descriptors from File System will reload all descriptors from disk. This is useful if you have made a change to the descriptor outside of the CPE Configurator, and want to refresh the display.
Clear All will reset the CPE Configurator to its initial state, with no components selected.
Exit will close the CPE Configurator. If you have unsaved changes, you will be prompted as to whether you would like to save them to a CPE Descriptor file. If you do not save them, they will be lost.
When you restart the CPE Configurator, it will automatically reload the last CPE descriptor file that you were working with.
3. Document Analyzer User’s Guide
The Document Analyzer is a tool provided by the UIMA SDK for testing annotators and AEs. It reads text files from your disk, processes them using an AE, and allows you to view the results. The Document Analyzer is designed to work with text files and cannot be used with Analysis Engines that process other types of data.
For an introduction to developing annotators and Analysis Engines, read xref:tug.adoc#ugr.tug.aae. This chapter is a user’s guide for using the Document Analyzer tool, and does not describe the process of developing annotators and Analysis Engines.
3.1. Starting the Document Analyzer
To run the Document Analyzer, execute the documentAnalyzer script that is in the bin directory of your UIMA SDK installation, or, if you are using the example Eclipse project, execute the “UIMA Document Analyzer” run configuration supplied with that project.
Note that if you’re planning to run an Analysis Engine other than one of the examples included in the UIMA SDK, you’ll first need to update your CLASSPATH environment variable to include the classes needed by that Analysis Engine.
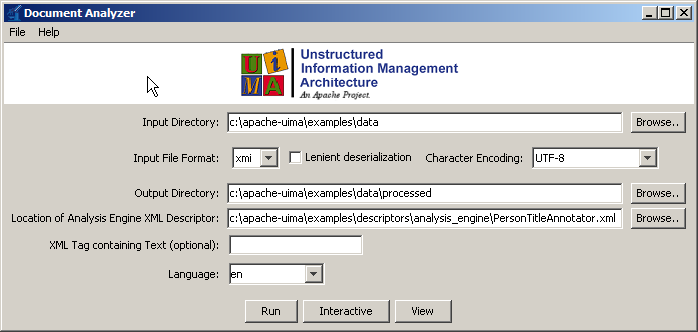
When you first run the Document Analyzer, you should see a screen that looks like this:
3.2. Running an AE
To run a AE, you must first configure the six fields on the main screen of the Document Analyzer.
Input Directory: Browse to or type the path of a directory containing text files that you want to analyze.
Some sample documents are provided in the UIMA SDK under the examples/data directory.
Input File Format: Set this to "text". It can, alternatively, be set to one of the two serialized forms for CASes, if you have previously generated and saved these. For the CAS formats only, you can also specify "Lenient deserialization"; if checked, then extra types and features in the CAS being deserialized and loaded (that are not defined by the Annotator-to-be-run’s type system) will not cause a deserialization error, but will instead be ignored.
Character Encoding: The character encoding of the input files.
The default, UTF-8, also works fine for ASCII text files.
If you have a different encoding, select it here.
For more information on character sets and their names, see the Javadocs for java.nio.charset.Charset.
Output Directory: Browse to or type the path of a directory where you want output to be written. (As we’ll see later, you won’t normally need to look directly at these files, but the Document Analyzer needs to know where to write them.) The files written to this directory will be an XML representation of the analyzed documents. If this directory doesn’t exist, it will be created. If the directory exists, any files in it will be deleted (but the tool will ask you to confirm this before doing so). If you leave this field blank, your AE will be run but no output will be generated.
Location of AE XML Descriptor: Browse to or type the path of the descriptor for the AE that you want to run.
There are some example descriptors provided in the UIMA SDK under the examples/descriptors/analysis_engine and examples/descriptors/tutorial directories.
XML Tag containing Text: This is an optional feature.
If you enter a value here, it specifies the name of an XML tag, expected to be found within the input documents, that contains the text to be analyzed.
For example, the value TEXT would cause the AE to only analyze the portion of the document enclosed within <TEXT>…</TEXT> tags.
Also, any XML tags occuring within that text will be removed prior to analysis.
Language: Specify the language in which the documents are written. Some Analysis Engines, but not all, require that this be set correctly in order to do their analysis. You can select a value from the drop-down list or type your own. The value entered here must be an ISO language identifier, the list of which can be found here: http://www.ics.uci.edu/pub/ietf/http/related/iso639.txt.
Once you’ve filled in the appropriate values, press the “Run” button.
If an error occurs, a dialog will appear with the error message. (A stack trace will also be printed to the console, which may help you if the error was generated by your own annotator code.) Otherwise, an “Analysis Results” window will appear.
3.3. Viewing the Analysis Results
After a successful analysis, the “Analysis Results” window will appear.
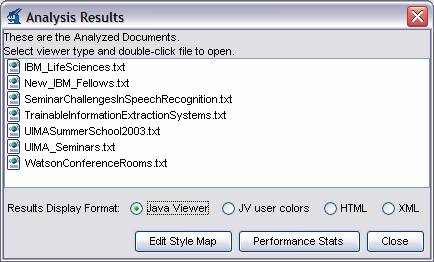
The “Results Display Format” options at the bottom of this window show the different ways you can view your analysis – the Java Viewer, Java Viewer (JV) with User Colors, HTML, and XML. The default, Java Viewer, is recommended.
Once you have selected your desired Results Display Format, you can double-click on one of the files in the list to view the analysis done on that file.
For the Java viewer, two different view modes are supported, each represented by one of two radio buttons titled "Annnotations", and "Features":
In the "Annotations" view, each annotation which is declared to be an output of the pipeline (in the top most Annotator Descriptor) is given a checkbox and a color, in the bottom panel.
You can control which annotations are shown by using the checkboxes in the bottom panel, the Select All button, or the Deselet All button.
The results display looks like this (for the AE descriptor examples/descriptors/tutorial/ex4/MeetingDetectorTAE.xml):
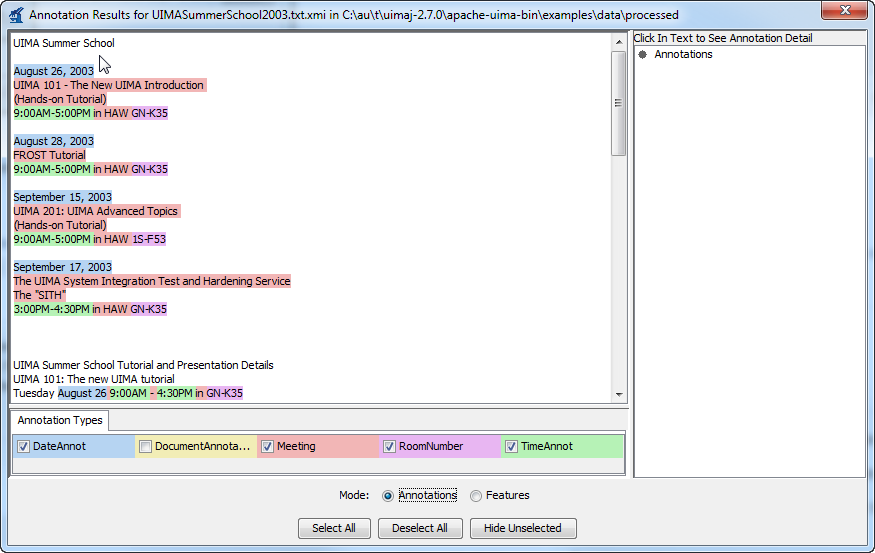
You can click the mouse on one of the highlighted annotations to see a list of all its features in the frame on the right.
In the "Features" view, you can specify a combination of a single type, a single feature of that type, and some feature values for that feature. The annotations whose feature values match will be highlighted. Step by step, you first select a specific type of annotations by using a radio button in the first tab of the legend.
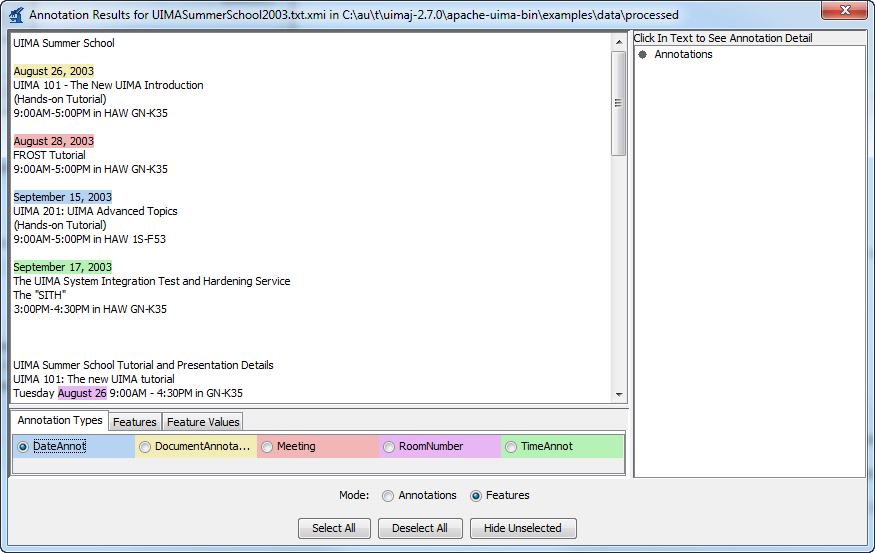
Selecting this automatically transitions to the second tab, where you then select a specific feature of the annotation type.
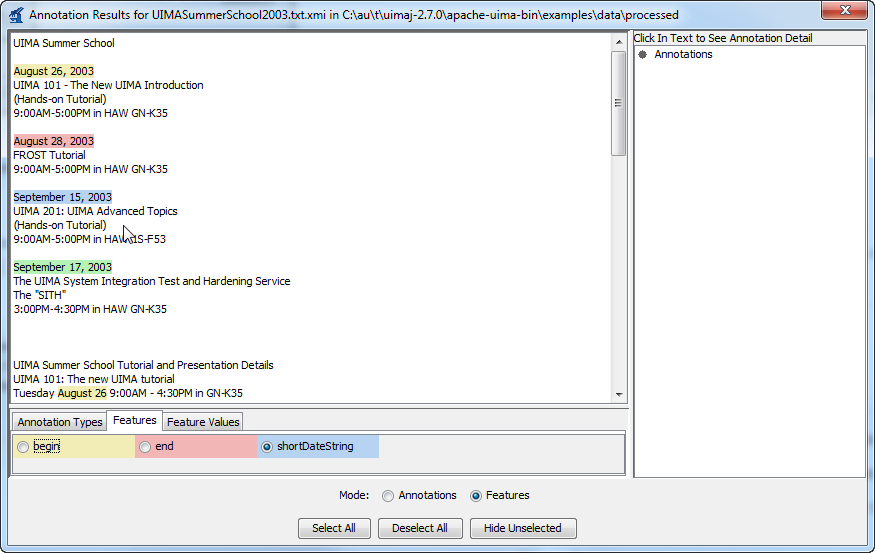
Selecting this again automatically transitions you to the thrid tab, where you select some specific feature values in the third tab of the legend.
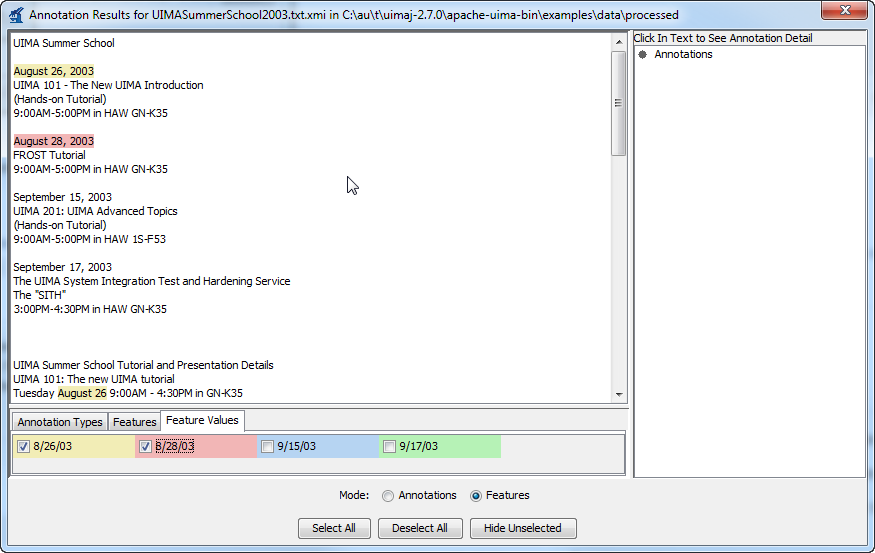
In each of the above two view modes, you can click the mouse on one of the highlighted annotations to see a list of all its features in the frame on the right.
If you are viewing a CAS that contains multiple subjects of analysis, then a selector will appear at the bottom right of the Annotation Viewer window. This will allow you to choose the Sofa that you wish to view. Note that only text Sofas containing a non-null document are available for viewing.
3.4. Configuring the Annotation Viewer
The “JV User Colors” and the HTML viewer allow you to specify exactly which colors are used to display each of your annotation types. For the Java Viewer, you can also specify which types should be initially selected, and you can hide types entirely.
To configure the viewer, click the “Edit Style Map” button on the “Analysis Results” dialog. You should see a dialog that looks like this:
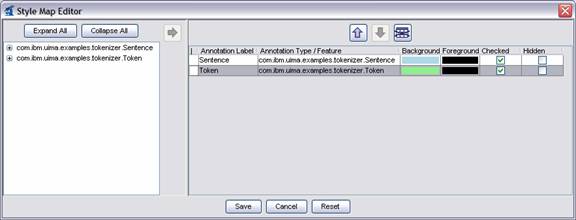
To change the color assigned to a type, simply click on the colored cell in the “Background” column for the type you wish to edit. This will display a dialog that allows you to choose the color. For the HTML viewer only, you can also change the foreground color.
If you would like the type to be initially checked (selected) in the legend when the viewer is first launched, check the box in the “Checked” column. If you would like the type to never be shown in the viewer, click the box in the “Hidden” column. These settings only affect the Java Viewer, not the HTML view.
When you are done editing, click the “Save” button. This will save your choices to a file in the same directory as your AE descriptor. From now on, when you view analysis results produced by this AE using the “JV User Colors” or “HTML” options, the viewer will be configured as you have specified.
3.5. Interactive Mode
Interactive Mode allows you to analyze text that you type or cut-and-paste into the tool, rather than requiring that the documents be stored as files.
In the main Document Analyzer window, you can invoke Interactive Mode by clicking the “Interactive” button instead of the “Run” button. This will display a dialog that looks like this:
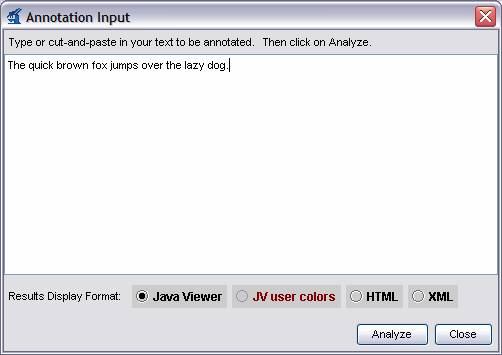
You can type or cut-and-paste your text into this window, then choose your Results Display Format and click the “Analyze” button. Your AE will be run on the text that you supplied and the results will be displayed as usual.
3.6. View Mode
If you have previously run a AE and saved its analysis results, you can use the Document Analyzer’s View mode to view those results, without re-running your analysis. To do this, on the main Document Analyzer window simply select the location of your analyzed documents in the “Output Directory” dialog and click the “View” button. You can then view your analysis results as described in Section Section 3.3.
4. Annotation Viewer
The Annotation Viewer is a tool for viewing analysis results that have been saved to your disk as external XML representations of the CAS. These are saved in a particular format called XMI. In the UIMA SDK, XML versions of CASes can be generated by:
-
Running the Document Analyzer, which saves an XML representations of the CAS to the specified output directory.
-
Running a Collection Processing Engine that includes the XMI Writer CAS Consumer (
examples/descriptors/cas_consumer/XmiWriterCasConsumer.xml). -
Explicitly creating XML representations of the CAS from your own application using the org.apache.uima.cas.impl.XMISerializer class. The best way to learn how to do this is to look at the example code for the XMI Writer CAS Consumer, located in
examples/src/org/apache/uima/examples/xmi/XmiWriterCasConsumer.java. [3]
|
Note
|
The Annotation Viewer only shows CAS views where the Sofa data type is a String. |
You can run the Annotation Viewer by executing the annotationViewer shell script located in the bin directory of the UIMA SDK or the "UIMA Annotation Viewer" Eclipse run configuration in the uimaj-examples project.
This will open the following window:
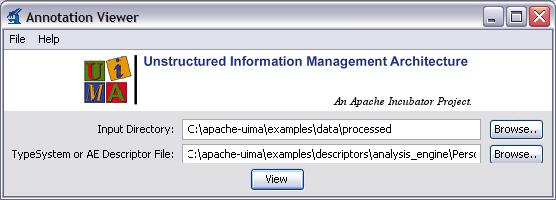
Select an input directory (which must contain XMI files), and the descriptor for the AE that produced the Analysis (which is needed to get the type system for the analysis). Then press the “View” button.
This will bring up a dialog where you can select a viewing format and double-click on a document to view it.
5. CAS Visual Debugger
5.1. Introduction
The CAS Visual Debugger is a tool to run text analysis engines in UIMA and view the results. The tool is implemented as a stand-alone GUI tool using Java’s Swing library.
This is a developer’s tool. It is intended to support you in writing text analysis annotators for UIMA (Unstructured Information Management Architecture). As a development tool, the emphasis is not so much on pretty pictures, but rather on navigability. It is intended to show you all the information you need, and show it to you quickly (at least on a fast machine ;-).
The main purpose of this application is to let you browse all the data that was created when you ran an analysis engine over some text. The display mimics the access methods you have in the CAS API in terms of indexes, types, feature structures and feature values.
As in the CAS, there is special support for annotations. Clicking on an annotation will select the corresponding text, and conversely, you can display all annotations that cover a given position in the text. This will be explained in more detail in the section on the main display area.
As usual, the graphics in this manual are for illustrative purposes and may not look 100% like the actual version of CVD you are running. This depends on your operating system, your version of Java, and a variety of other factors.
5.1.1. Running CVD
You will usually want to start CVD from the command line, or from Eclipse. To start CVD from the command line, you minimally need the uima-core and uima-tools jars. Below is a sample command line for sh and its offspring.
java -cp ${UIMA_HOME}/lib/uima-core.jar:${UIMA_HOME}/lib/uima-tools.jar
    org.apache.uima.tools.cvd.CVD
However, there is no need to type this.
The ${UIMA_HOME}/bin directory contains a cvd.sh and cvd.bat file for Unix/Linux/MacOS and Windows, respectively.
In Eclipse, you have a ready to use launch configuration available when you have installed the UIMA sample project). Below is a screenshot of the the Eclipse Run dialog with the CVD run configuration selected.
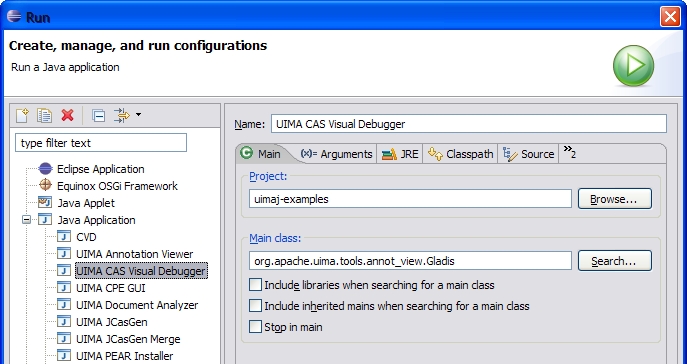
5.1.2. Command line parameters
You can provide some command line parameters to influence the startup behavior of CVD. For example, if you want to run a certain analysis engine on a certain text over and over again (for debugging, say), you can make CVD load the annotator and text at startup and execute the annotator. Here’s a list of the supported command line options.
| Option | Description |
|---|---|
|
Loads the text file |
|
Loads the descriptor |
|
Runs the pre-loaded annotator; only allowed in conjunction with |
|
Sets the data path to |
|
Makes CVD use alternative ini file |
|
Uses alternative look-and-feel |
5.2. Error Handling
On encountering an error, CVD will pop up an error dialog with a short, usually incomprehensible message. Often, the error message will claim that there is more information available in the log file, and sometimes, this is actually true; so do go and check the log. You can view the log file by selecting the appropriate item in the "Tools" menu.

5.3. Preferences File
The program will attempt to read on startup and save on exit a file called annotViewer.pref in your home directory. This file contains information about choices you made while running the program: directories (such as where your data files are) and window sizes. These settings will be used the next time you use the program. There is no user control over this process, but the file format is reasonably transparent, in case you feel like changing it. Note, however, that the file will be overwritten every time you exit the program.
If you use CVD for several projects, it may be convenient to use a different ini files for each project. You can specify the ini file CVD should use with the
-ini <iniFile>parameter on the command line.
5.4. The Menus
We give a brief description of the various menus. All menu items come with mnemonics (e.g., Alt-F X will exit the program). In addition, some menu items have their own keyboard accelerators that you can use anywhere in the program. For example, Ctrl-S will save the text you’ve been editing.
5.4.1. The File Menu
The File menu lets you load, create and save text, load and save color settings, and import and export the XCAS format. Here’s a screenshot.
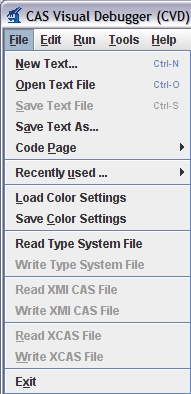
Below is a list of the menu items, together with an explanation.
Clears the text area. Text you type is written to an anonymous buffer. You can use "Save Text As…" to save the text you typed to a file. Note: whenever you modify the text, be it through typing, loading a file or using the "New Text…" menu item, previous analysis results will be lost. Since the previous analysis is specific to the text, modifying the text invalidates the analysis.
Loads a new text file into the viewer. The next time you run an analysis engine, it will run the text you loaded last. Depending on the annotator you’re using, the program may run slow with very large text files, so you may want to experiment.
Saves the currently open text file. If no file is currently loaded (either because you haven’t loaded a file, or you’ve used the "New Text…" menu item), this menu item is disabled (and Ctrl-S will do nothing).
Save the text to a file of your choosing. This can be an existing file, which is then overwritten, or it can be a new file that you’re creating.
Allows you to change the code page that is used to load and save text files.
If you’re sure the text you’re loading is in ASCII or one of the 8-bit extensions such as ISO-8859-1 (ISO Latin1), there is probably nothing you need to do.
Just load the text and look at the display.
If you see no funny characters or square boxes, chances are your selected code page is compatible with your text file.
Note that the code page setting is also in effect when you save files.
You can observe the effects with a hex editor or by just looking at the file size.
For example, if you save the default text This is where the text goes. to a file on Windows using the default code page, the size of the file will be 28 bytes.
If you now change the code page to UTF-16 and save the file again, the file size will be 58 bytes: two bytes for each character, plus two bytes for the byte-order mark.
Now switch the code page back to the default Windows code page and reload the UTF-16 file to see the difference in the editor.
CVD will display all code pages that are available in the JVM you’re running it on.
The first code page in the list is the default code page of your system.
This is also CVD’s default if you don’t make a specific choice.
Your code page selection will be remembered in CVD’s ini file.
Load previously saved color settings from a file (see Tools/Customize Annotation Display). It is highly recommended that you only load automatically generated files. Strange things may happen if you try to load the wrong file format. On startup, the program attempts to load the last color settings file that you loaded or saved during a previous session. If you intend to use the same color settings as the last time you ran the program, there is therefore no need to manually load a color settings file.
Save your customized color settings (see Tools/Customize Annotation Display). The file is a Java properties file, and as such, reasonably transparent. What is not transparent is the encoding of the colors (integer encoding of 24-bit RGB values), so changing the file by hand is not really recommended.
Load a type system file. This allows you to load an XCAS file without having to have access to the corresponding annotator.
Create a type system file from the currently loaded type definitions. In addition, you can save the current CAS as a XCAS file (see below). This allows you to later load the type system and XCAS to view the CAS without having to rerun the annotator.
Read an XMI CAS file. Important: XMI CAS is a serialization format that serializes a CAS without type system and index information. It is therefore impossible to read in a stand-alone XMI CAS file. XMI CAS files can only be interpreted in the context of an existing type system. Consequently, you need to first load the Analysis Engine that was used to create the XMI file, to be able to load that XMI file.
Writes the current analysis out as an XMI CAS file.
Read an XCAS file. Important: XCAS is a serialization format that serializes a CAS without type system and index information. It is therefore impossible to read in a stand-alone XCAS file. XCAS files can only be interpreted in the context of an existing type system. Consequently, you need to load the Analysis Engine that was used to create the XCAS file to be able to load it. Loading a XCAS file without loading the Analysis Engine may produce strange errors. You may get syntax errors on loading the XCAS file, or worse, everything may appear to go smoothly but in reality your CAS may be corrupted.
Writes the current analysis out as an XCAS file.
Exits the program. Your preferences will be saved.
5.4.2. The Edit Menu
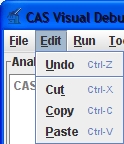
The "Edit" menu provides a standard text editing menu with Cut, Copy and Paste, as well as unlimited Undo.
Note that standard keyboard accelerators Ctrl-X, Ctrl-C, Ctrl-V and Ctrl-Z can be used for Cut, Copy, Paste and Undo, respectively. The text area supports other standard keyboard operations such as navigation HOME, Ctrl-HOME etc., as well as marking text with Shift- <ArrowKey>.
5.4.3. The Run Menu
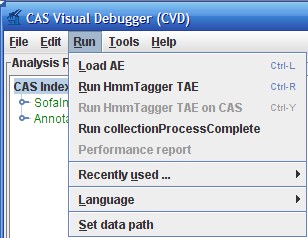
In the Run menu, you can load and run text analysis engines.
Loads and initializes a text analysis engine. Choosing this menu item will display a file open dialog where you should choose an XML descriptor of a Text Analysis Engine to process the current text. Even if the analysis engine runs fast, this will take a while, since there is a lot of setup work to do when a new TAE is created. So be patient. When you develop a new annotator, you will often need to recompile your code. Gladis will not reload your annotator code. When you recompile your code, you need to terminate the GUI and restart it. If you only make changes to the XML descriptor, you don’t need to restart the GUI. Simply reload the XML file.
Before you have (successfully) loaded a TAE, this menu item will be disabled. After you have loaded a TAE, it will be enabled, and the name changes according to the name of the TAE you have loaded. For example, if you’ve loaded "The World’s Fastest Parser", you will have a menu item called "Run The World’s Fastest Parser". When you choose the item, the TAE is run on whatever text you have currently loaded. After a TAE has run successfully, the index window in the upper left-hand corner of the screen should be updated and show the indexes that were created by this run. We will have more to say about indexes and what to do with them later.
This allows you to run an analysis engine on the current CAS. This is useful if you have loaded a CAS from an XCAS file, and would like to run further analysis on it.
When you select this item, the analysis engine’s collectionProcessComplete() method is called.
After you’ve run your analysis, you can view a performance report. It will show you where the time went: which component used how much of the processing time.
Collects a list of recently used analysis engines as a short-cut for loading.
Some annotators do language specific processing. For example, if you run lexical analysis, the results may be quite different depending on what the analysis engine thinks the language of the document is. With this menu item, you can manually set the document language. Alternatively, you can use an automatic language identification annotator. If the analysis engines you’re working with are language agnostic, there is no need to set the language.
5.4.4. The tools menu
The tools menu contains some assorted utilities, such as the log file viewer. Here you can also set the log level for UIMA. A more detailed description of some of the menu items follows below.
View Type System
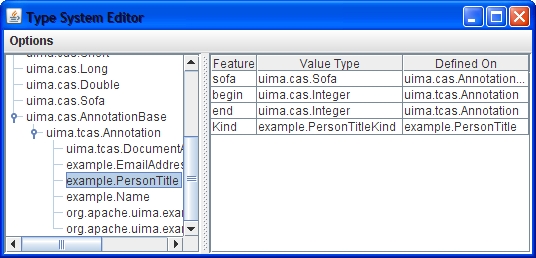
Brings up a new window that displays the type system. This menu item is disabled until the first time you have run an analysis engine, since there is no type system to display until then. An example is shown above.
You can view the inheritance tree on the left by expanding and collapsing nodes. When you select a type, the features defined on that type are displayed in the table on the right. The feature table has three columns. The first gives the name of the feature, the second one the type of the feature (i.e., what values it takes), and the third column displays the highest type this feature is defined on. In this example, the features "begin" and "end" are inherited from the built-in annotation type.
In the options menu, you can configure if you want to see inherited features or not (not yet implemented).
Show Selected Annotations
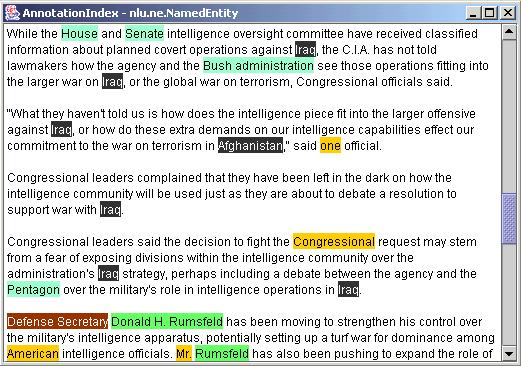
To enable this menu, you must have run an analysis engine and selected the ``AnnotationIndex'' or one of its subnodes in the upper left hand corncer of the screen. It will bring up a new text window with all selected annotations marked up in the text.
Figure 23 shows the results of applying a statistical named entity tagger to a newspaper article. Some annotation colors have been customized: countries are in reverse video, organizations have a turquois background, person names are green, and occupations have a maroon background. The default background color is yellow. This color is also used if there is more than one annotation spanning a certain text. Clearly, this display is only useful if you don’t have any overlapping annotations, or at least not too many.
This menu item is also available as a context menu in the Index Tree area of the main window. To use it, select the annotation index or one of its subnodes, right-click to bring up a popup menu, and select the only item in the popup menu. The popup menu is actually a better way to invoke the annotation display, since it changes according to the selection in the Index Tree area, and will tell you if what you’ve selected can be displayed or not.
5.5. The Main Display Area
The main display area has three sub-areas. In the upper left-hand corner is the index display, which shows the indexes that were defined in the AE, as well as the types of the indexes and their subtypes. In the lower left-hand corner, the content of indexes and sub-indexes is displayed (FS display). Clicking on any node in the index display will show the corresponding feature structures in the FS display. You can explore those structures by expanding the tree nodes. When you click on a node that represents an annotation, clicking on it will cause the corresponding text span to marked in the text display.
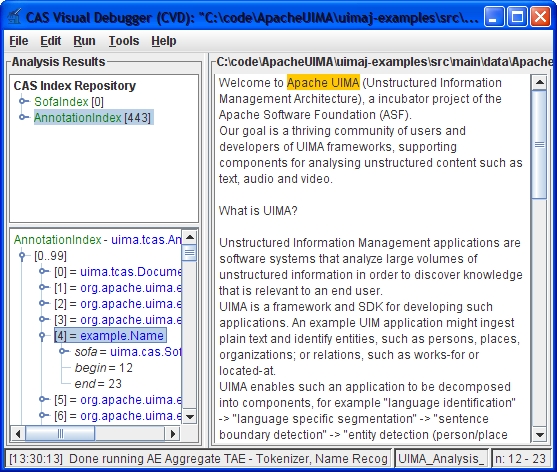
Figure 24 shows the state after running the UIMA_Analysis_Example.xml aggregate from the uimaj-examples project. There are two indexes in the index display, and the annotation index has been selected. Note that the number of structures in an index is displayed in square brackets after the index name.
Since displaying thousands of sister nodes is both confusing and slow, nodes are grouped in powers of 10. As soon as there are no more than 100 sister nodes, they are displayed next to each other.
In our example, a name annotation has been selected, and the corresponding token text is highlighted in the text area. We have also expanded the token node to display its structure (not much to see in this simple example).
In Figure 24, we selected an annotation in the FS display to find the corresponding text. We can also do the reverse and find out what annotations cover a certain point in the text. Let’s go back to the name recognizer for an example.
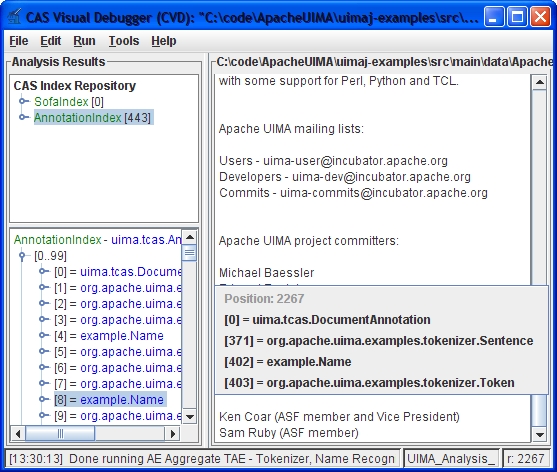
We would like to know if the Michael Baessler has been recognized as a name. So we position the cursor in the corresponding text span somewhere, then right-click to bring up the context menu telling us which annotations exist at this point. An example is shown in Figure 25.
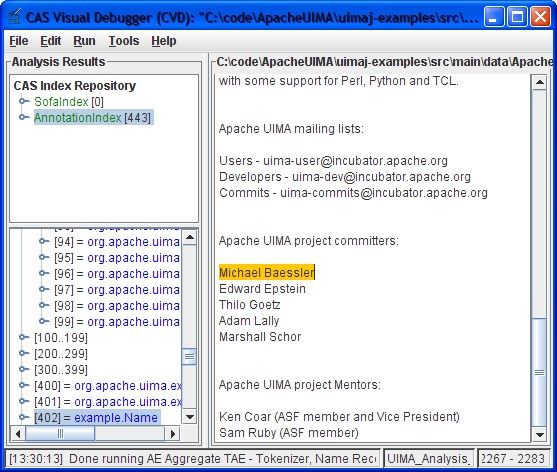
At this point (Figure 25), we only know that somewhere around the text cursor position (not visible in the picture), we discovered a name. When we select the corresponding entry in the context menu, the name annotation is selected in the FS display, and its covered text is highlighted. Figure 26 shows the display after the name node has been selected in the popup menu.
We’re glad to see that, indeed, Michael Baessler is considered to be a name. Note that in the FS display, the corresponding annotation node has been selected, and the tree has been expanded to make the node visible.
NB that the annotations displayed in the popup menu come from the annotations currently displayed in the FS display. If you didn’t select the annotation index or one of its sub-nodes, no annotations can be displayed and the popup menu will be empty.
5.5.1. The Status Bar
At the bottom of the screen, some useful information is displayed in the status bar. The left-most area shows the most recent major event, with the time when the event terminated in square brackets. The next area shows the file name of the currently loaded XML descriptor. This area supports a tool tip that will show the full path to the file. The right-most area shows the current cursor position, or the extent of the selection, if a portion of the text has been selected. The numbers correspond to the character offsets that are used for annotations.
5.5.2. Keyboard Navigation and Shortcuts
The GUI can be completely navigated and operated through the keyboard. All menus and menu items support keyboard mnemonics, and some common operations are accessible through keyboard accelerators.
You can move the focus between the three main areas using Tab (clockwise) and Shift-Tab (counterclockwise). When the focus is on the text area, the Tab key will insert the corresponding character into the text, so you will need to use Ctrl-Tab and Ctrl-Shift-Tab instead.
Alternatively, you can use the following key bindings to jump directly to one of the areas: Ctrl-T to focus the text area, Ctrl-I for the index repository frame and Ctrl-F for the feature structure area.
Some additional keyboard shortcuts are available only in the text area, such as Ctrl-X for Cut, Ctrl-C for Copy, Ctrl-V for Paste and Ctrl-Z for Undo.
The context menu in the text area can be evoke through the Alt-Enter shortcut.
Text can be selected using the arrow keys while holding the Shift key.
The following table shows the supported keyboard shortcuts.
| Shortcut | Action | Scope |
|---|---|---|
|
Open text file |
Global |
|
Save text file |
Global |
|
Load AE descriptor |
Global |
|
Run current AE |
Global |
|
Switch focus to index repository |
Global |
|
Switch focus to text area |
Global |
|
Switch focus to FS area |
Global |
|
Cut selection |
Text |
|
Copy selection |
Text |
|
Paste selection |
Text |
|
Undo |
Text |
|
Show context menu |
Text |
6. Eclipse Analysis Engine Launcher’s Guide
The Analysis Engine Launcher is an Eclipse plug-in that provides debug and run support for Analysis Engines directly within eclipse, like a Java program can be debugged. It supports most of the descriptor formats except CPE, UIMA AS and some remote deployment descriptors.
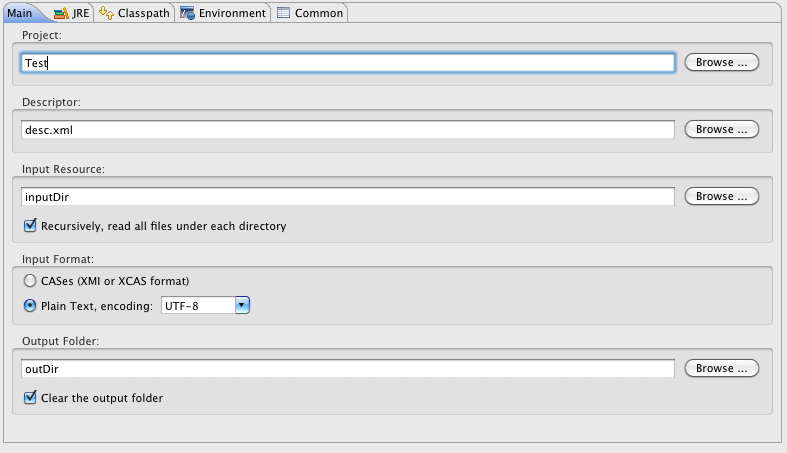
6.1. Creating an Analysis Engine launch configuration
To debug or run an Analysis Engine a launch configuration must be created. To do this select "Run → Run Configurations" or "Run → Run Configurations" from the menu bar. A dialog will open where the launch configuration can be created. Select UIMA Analysis Engine and create a new configuration via pressing the New button at the top, or via the New button in the context menu. The newly created configuration will be automatically selected and the Main tab will be displayed.
The Main tab defines the Analysis Engine which will be launched. First select the project which contains the descriptor, then choose a descriptor and select the input. The input can either be a folder which contains input files or just a single input file, if the recursively check box is marked the input folder will be scanned recursively for input files.
The input format defines the format of the input files, if it is set to CASes the input resource must be either in the XMI or XCAS format and if it is set to plain text, plain text input files in the specified encoding are expected. The input logic filters out all files which do not have an appropriate file ending, depending on the chosen format the file ending must be one of .xcas, .xmi or .txt, all other files are ignored when the input is a folder, if a single file is selected it will be processed independent of the file ending.
The output directory is optional, if set all processed input files will be written to the specified directory in the XMI CAS format, if the clear check box is marked all files inside the output folder will be deleted, usually this option is not needed because existing files will be overwritten without notice.
The other tabs in the launch configuration are documented in the eclipse documentation, see the "Java development user guide → Tasks → Running and Debugging".
6.2. Launching an Analysis Engine
To launch an Analysis Engine go to the previously created launch configuration and click on "Debug" or "Run" depending on the desired run mode. The Analysis Engine will now be launched. The output will be shown in the Console View. To debug an Analysis Engine place breakpoints inside the implementation class. If a breakpoint is hit the execution will pause like in a Java program.
7. Cas Editor User’s Guide
7.1. Introduction
The CAS Editor is an Eclipse based annotation tool which supports manual and automatic annotation (via running UIMA annotators) of CASes stored in files. Currently only text-based CAS are supported. The CAS Editor can visualize and edit all feature structures. Feature Structures which are annotations can additionally be viewed and edited directly on text.
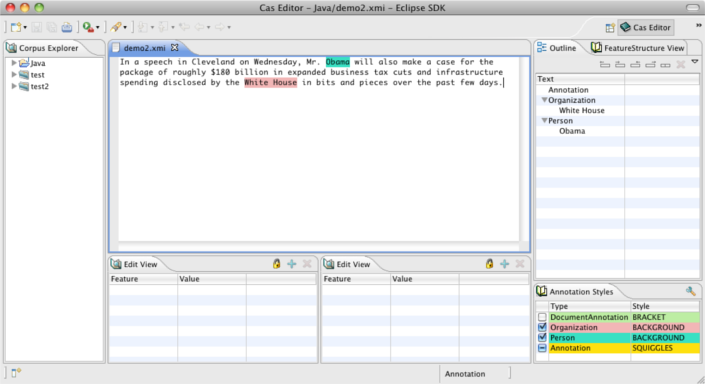
7.2. Launching the Cas Editor
To open a CAS in the Cas Editor it needs a compatible type system and styling information which specify how to display the types. The styling information is created automatically by the Cas Editor; but the type system file must be provided by the user.
A CAS in the xmi or xcas format can simply be opened by clicking on it, like a text file is opened with the Eclipse text editor.
7.2.1. Specifying a type system
The Cas Editor expects a type system file at the root of the project named TypeSystem.xml. If a type system cannot be found, this message is shown:
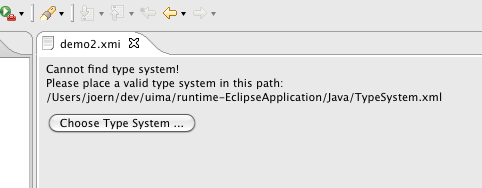
If the type system file does not exist in this location you can point the Cas Editor to a specific type system file. You can also change the default type system location in the properties page of the Eclipse project. To do that right click the project, select Properties and go to the UIMA Type System tab, and specify the default location for the type system file.
After the Cas Editor is opened switch to the Cas Editor Perspective to see all the Cas Editor related views.
7.3. Annotation editor
The annotation editor shows the text with annotations and provides different views to show aspects of the CAS.
7.3.1. Editor
After the editor is open it shows the default sofa of the CAS. (Displaying another sofa is right now not possible.) The editor has an associated, changeable CAS Type. This type is called the editor "mode". By default the editor only shows annotation of this type. Actions and views are sensitive to this mode. The next screen shows the display, where the mode is set to "Person":

				 To change the mode for the editor, use the "Mode" menu in the editor context menu.
To open the context menu right click somewhere on the text.
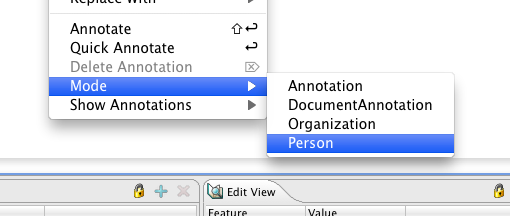
The current mode is displayed in the status line at the bottom and in the Style View.
It’s possible to work with more than one annotation type at a time; the mode just selects the default annotation type which can be marked with the fewest keystrokes. To show annotations of other types, use the "Show" menu in the context menu.
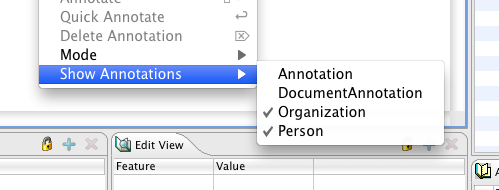
Alternatively, you may select the annotation types to be shown in the Style View.
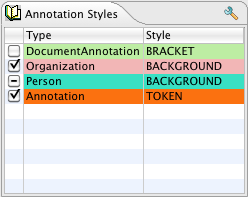
The editor will show the additional selected types.

				 The annotation renderer and rendering layer can be changed in the Properties dialog.
After the change all editors which share the same type system will be updated.
The editor automatically selects annotations of the editor mode type that are near the cursor. This selection is then synchronized or displayed in other views.
To create an annotation manually using the editor, mark a piece of text and then press the enter key. This creates an annotation of the type of the editor mode, having bounds corresponding to the selection. You can also use the "Quick Annotate" action from the context menu.
It is also possible to choose the annotation type; press shift + enter (smart insert) or click on "Annotate" in the context menu for this. A dialog will ask for the annotation type to create; either select the desired type or use the associated key shortcut. In the screen shot below, pressing the "p" key will create a Person annotation for "Obama".
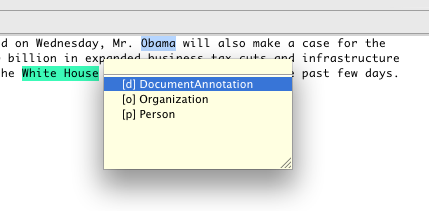
To delete an annotation, select it and press the delete key. Only annotations of the editor mode can be deleted with this method. To delete non-editor mode annotations use the Outline View.
For annotation projects you can change the font size in the editor. The default font size is 13. To change this open the Eclipse preference dialog, go to "UIMA Annotation Editor".
7.3.2. Configure annotation styling
The Cas Editor can visualize the annotations in multiple highlighting colors and with different annotation drawing styles. The annotation styling is defined per type system. When its changed, the appearance changes in all opened editors sharing a type system.
The styling is initialized with a unique color for every annotation type and every annotation is drawn with Squiggles annotation style. You may adjust the annotation styles and coloring depending on the project needs.
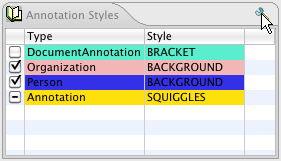
The Cas Editor offers a property page to edit the styling. To open this property page click on the "Properties" button in the Styles view.
The property page can be seen below. By clicking on one of the annotation types, the color, drawing style and drawing layer can be edited on the right side.
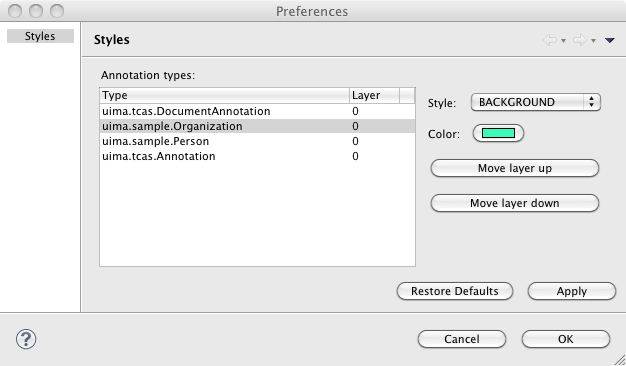
The annotations can be visualized with one the following annotation stlyes:
| Style | Sample | Description |
|---|---|---|
BACKGROUND |
image::images/tools/tools.caseditor/Style-Background.png[] |
The background is drawn in the annotation color. |
TEXT_COLOR |
image::images/tools/tools.caseditor/Style-TextColor.png[] |
The text is drawn in the annotation color. |
TOKEN |
image::images/tools/tools.caseditor/Style-Token.png[] |
The token type assumes that token annotation are always separated by a whitespace. Only if they are not separated by a whitespace a vertical line is drawn to display the two token annotations. The image on the left actually contains three annotations, one for "Mr", "." and "Obama". |
SQUIGGLES |
image::images/tools/tools.caseditor/Style-Squiggles.png[] |
Squiggles are drawen under the annotation in the annotation color. |
BOX |
image::images/tools/tools.caseditor/Style-Box.png[] |
A box in the annotation color is drawn around the annotation. |
UNDERLINE |
image::images/tools/tools.caseditor/Style-Underline.png[] |
A line in the annotation color is drawen below the annotation. |
BRACKET |
image::images/tools/tools.caseditor/Style-Bracket.png[] |
An opening bracket is drawn around the first character of the annotation and a closing bracket is drawn around the last character of the annotation. |
The Cas Editor can draw the annotations in different layers. If the spans of two annotations overlap the annotation which is in a higher layer is drawn over annotations in a lower layer. Depending on the drawing style it is possible to see both annotations. The drawing order is defined by the layer number, layer 0 is drawn first, then layer 1 and so on. If annotations in the same layer overlap its not defined which annotation type is drawn first.
7.3.3. CAS view support
The Annotation Editor can only display text Sofa CAS views. Displaying CAS views with Sofas of different types is not possible and will show an editor page to switch back to another CAS view. The Edit and Feature Structure Browser views are still available and might be used to edit Feature Structures which belong to the CAS view.
To switch to another CAS view, right click in the editor to open the context menu and choose "CAS Views" and the view the editor should switch to.
7.3.4. Outline view
The outline view gives an overview of the annoations which are shown in the editor. The annotation are grouped by type. There are actions to increase or decrease the bounds of the selected annotation. There is also an action to merge selected annotations. The outline has second view mode where only annotations of the current editor mode are shown.
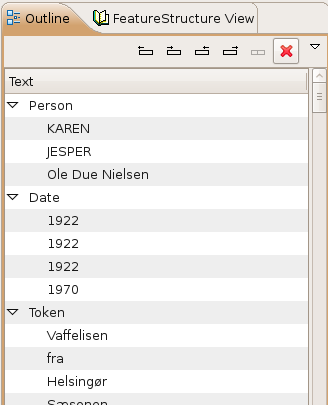
The style can be switched in the view menu, to a style where it only shows the annotations which belong to the current editor mode.
7.3.5. Edit Views
The Edit Views show details about the currently selected annotations or feature structures. It is possible to change primitive values in this view. Referenced feature structures can be created and deleted, including arrays. To link a feature structure with other feature structures, it can be pinned to the edit view. This means that it does not change if the selection changes.
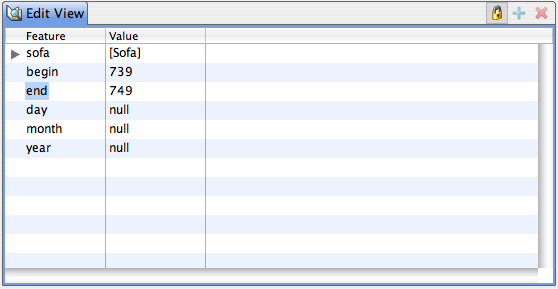
7.4. Implementing a custom Cas Editor View
Custom Cas Editor views can be added, to rapidly create, access and/or change Feature Structures in the CAS. While the Annotation Editor and its views offer support for general viewing and editing, accessing and editing things in the CAS can be streamlined using a custom Cas Editor. A custom Cas Editor view can be programmed to use a particular type system and optimized to quickly change or show something.
Annotation projects often need to track the annotation status of a CAS where a user needs to mark which parts have been annotated or corrected. To do this with the Cas Editor a user would need to use the Feature Structure Browser view to select the Feature Structure and then edit it inside the Edit view. A custom Cas Editor view could directly select and show the Feature Structure and offer a tailored user interface to change the annotation status. Some features such as the name of the annotator could even be automatically filled in.
The creation of Feature Structures which are linked to existing annotations or Feature Structures is usually difficult with the standard views. A custom view which can make assumptions about the type system is usually needed to do this efficiently.
7.4.1. Annotation Status View Sample
The Cas Editor provides the CasEditorView class as a base class for views which need to access the CAS which is opened in the current editor. It shows a "view not available" message when the current editor does not show a CAS, no editor is opened at all or the current CAS view is incompatible with the view.
The following snippet shows how it is usually implemented:
public class AnnotationStatusView extends CasEditorView {

  public AnnotationStatusView() {
    super("The Annotation Status View is currently not available.");
  }

  @Override
  protected IPageBookViewPage doCreatePage(ICasEditor editor) {
    ICasDocument document = editor.getDocument();

    if (document != null) {
      return new AnnotationStatusViewPage(editor);
    }

    return null;
  }
}
The doCreatePage method is called to create the actual view page.
If the document is null the editor failed to load a document and is showing an error message.
In the case the document is not null but the CAS view is incompatible the method should return null to indicate that it has nothing to show.
In this case the "not available" message is displayed.
The next step is to implement the AnnotationStatusViewPage. That is the page which gets the CAS as input and need to provide the user with a ui to change the Annotation Status Feature Structure.
public class AnnotationStatusViewPage extends Page {

  private ICasEditor editor;

  AnnotationStatusViewPage(ICasEditor editor) {
    this.editor = editor;
  }

  ...

  public void createControl(Composite parent) {

    // create ui elements here

    ...

    ICasDocument document = editor.getDocument();
    CAS cas = document.getCAS();

    // Retrieve Annotation Status FS from CAS
    // and initalize the ui elements with it

    FeatureStructre statusFS;

    ...

    // Add event listeners to the ui element
    // to save an update to the CAS
    // and to advertise a change

    ...

    // Send update event
    document.update(statusFS);

  }
}
The above code sketches out how a typical view page is implemented. The CAS can be directly used to access any Feature Structures or annotations stored in it. When something is modified added/removed/changed that must be advertised via the ICasDocument object. It has multiple notification methods which send an event so that other views can be updated. The view itself can also register a listener to receive CAS change events.
8. JCasGen User’s Guide
JCasGen reads a descriptor for an application (either an Analysis Engine Descriptor, or a Type System Descriptor), creates the merged type system specification by merging all the type system information from all the components referred to in the descriptor, and then uses this merged type system to create Java source files for classes that enable JCas access to the CAS.
Java classes are not produced for the built-in types, since these classes are already provided by the UIMA SDK.
(An exception is the built-in type uima.tcas.DocumentAnnotation, see the warning below.)
|
Warning
|
If the components comprising the input to the type merging process have different definitions for the same type name, JCasGen will show a warning, and in some environments may offer to abort the operation. If you continue past this warning, JCasGen will produce correct Java source files representing the merged types (that is, the type definition containing all of the features defined on that type by all of the components). It is recommended that you do not use this capability (of having two different definitions for the same type name, with different feature sets) since it can make it difficult to combine/package your annotator with others. Also note that if your type system declares a custom version of the |
JCasGen can be run in many ways. For Eclipse users using the Component Descriptor Editor, there’s a button on the Type System Description page to run it on that type system. There’s also a jcasgen-maven-plugin to use in maven build scripts. There’s a menu-driven GUI tool for it. And, there are command line scripts you can use to invoke it.
There are several versions of JCasGen. The basic version reads an XML descriptor which contains a type system descriptor, and generates the corresponding Java Class Models for those types. Variants exist for the Eclipse environment that allow merging the newly generated Java source code with previously augmented versions.
Input to JCasGen needs to be mostly self-contained.
In particular, any types that are defined to depend on user-defined supertypes must have that supertype defined, if the supertype is uima.tcas.Annotation or a subtype of it.
Any features referencing ranges which are subtypes of uima.cas.String must have those subtypes included.
If this is not followed, a warning message is given stating that the resulting generation may be inaccurate.
JCasGen is typically invoked automatically when using the Component Descriptor Editor, but can also be run using a shell script. These scripts can take 0, 1, or 2 arguments. The first argument is the location of the file containing the input XML descriptor. The second argument specifies where the generated Java source code should go. If it isn’t given, JCasGen generates its output into a subfolder called JCas (or sometimes JCasNew — see below), of the first argument’s path.
The first argument, the input file, can be written as jar:<url>!{entry}, for example: jar:http://www.foo.com/bar/baz.jar!/COM/foo/quux.class
If no arguments are given to JCasGen, then it launches a GUI to interact with the user and ask for the same input. The GUI will remember the arguments you previously used. Here’s what it looks like:
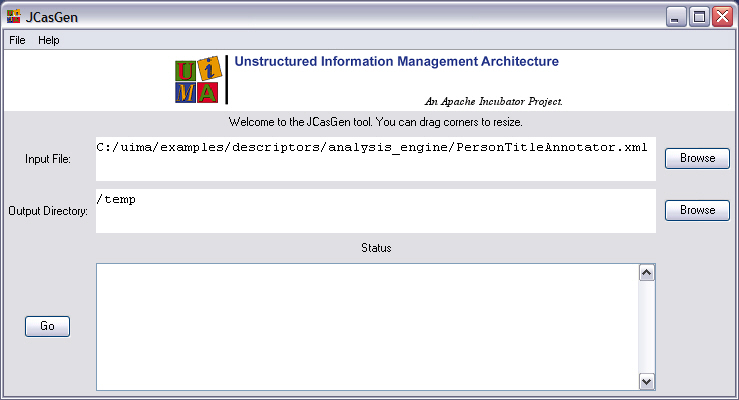
When running with automatic merging of the generated Java source with previously augmented versions, the output location is where the merge function obtains the source for the merge operation.
As is customary for Java, the generated class source files are placed in the appropriate subdirectory structure according to Java conventions that correspond to the package (name space) name.
The Java classes must be compiled and the resulting class files included in the class path of your application; you make these classes available for other annotator writers using your types, perhaps packaged as an xxx.jar file. If the xxx.jar file is made to contain only the Java Class Models for the CAS types, it can be reused by any users of these types.
8.1. Running stand-alone without Eclipse
There is no capability to automatically merge the generated Java source with previous versions, unless running with Eclipse. If run without Eclipse, no automatic merging of the generated Java source is done with any previous versions. In this case, the output is put in a folder called “JCasNew” unless overridden by specifying a second argument.
The distribution includes a shell script/bat file to run the stand-alone version, called jcasgen.
8.2. Running stand-alone with Eclipse
If you have Eclipse and EMF (EMF = Eclipse Modeling Framework; both of these are available from http://www.eclipse.org) installed (version 3 or later) JCasGen can merge the Java code it generates with previous versions, picking up changes you might have inserted by hand. The output (and source of the merge input) is in a folder “JCas” under the same path as the input XML file, unless overridden by specifying a second argument.
You must install the UIMA plug-ins into Eclipse to enable this function.
The distribution includes a shell script/bat file to run the stand-alone with Eclipse version, called jcasgen_merge. This works by starting Eclipse in “headless” mode (no GUI) and invoking JCasGen within Eclipse. You will need to set the ECLIPSE_HOME environment variable or modify the jcasgen_merge shell script to specify where to find Eclipse. The version of Eclipse needed is 3 or higher, with the EMF plug-in and the UIMA runtime plug-in installed. A temporary workspace is used; the name/location of this is customizable in the shell script.
Log and error messages are written to the UIMA log. This file is called uima.log, and is located in the default working directory, which if not overridden, is the startup directory of Eclipse.
8.3. Running within Eclipse
There are two ways to run JCasGen within Eclipse. The first way is to configure an Eclipse external tools launcher, and use it to run the stand-alone shell scripts, with the arguments filled in. Here’s a picture of a typical launcher configuration screen (you get here by navigating from the top menu: Run –> External Tools –> External tools…).
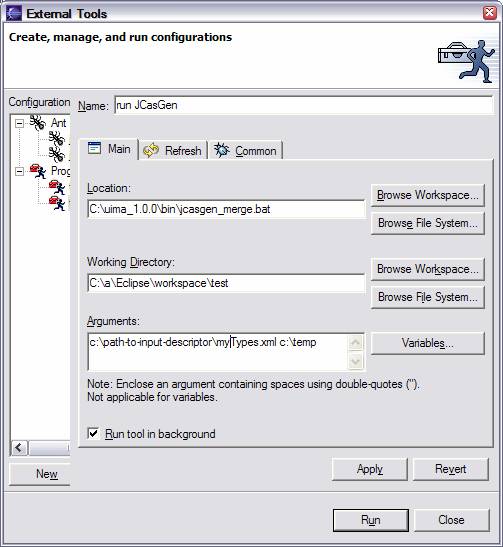
The second way (which is the normal way it’s done) to run within Eclipse is to use the Component Descriptor Editor (CDE). This tool can be configured to automatically launch JCasGen whenever the type system descriptor is modified. In this release, this operation completely regenerates the files, even if just a small thing changed. For very large type systems, you probably don’t want to enable this all the time. The configurator tool has an option to enable/disable this function.
8.4. Using the jcasgen-maven-plugin
For Maven builds, you can use the jcasgen-maven-plugin to take one or more top level descriptors (Type System or Analysis Engine descriptors), merge them together in the standard way UIMA merges type definitions, and produce the corresponding JCas source classes. These, by default, are generated to the standard spot for Maven builds for generated files.
You can use ant-like include / exclude patterns to specify the top level descriptor files.
If you set <limitToProject> to true, then after a complete UIMA type system merge is done with all of the types, including those that are imported, only those types which are defined within this Maven project (that is, in some subdirectory of the project) will be generated.
To use the jcasgen-maven-plugin, specify it in the POM as follows:
<plugin>
  <groupId>org.apache.uima</groupId>
  <artifactId>jcasgen-maven-plugin</artifactId>
  <version>2.4.1</version>  <!-- change this to the latest version -->
  <executions>
    <execution>
      <goals><goal>generate</goal></goals>  <!-- this is the only goal -->
      <!-- runs in phase process-resources by default -->
      <configuration>

        <!-- REQUIRED -->
        <typeSystemIncludes>
          <!-- one or more ant-like file patterns
               identifying top level descriptors -->
          <typeSystemInclude>src/main/resources/MyTs.xml
          </typeSystemInclude>
        </typeSystemIncludes>

        <!-- OPTIONAL -->
        <!-- a sequence of ant-like file patterns
             to exclude from the above include list -->
        <typeSystemExcludes>
        </typeSystemExcludes>

        <!-- OPTIONAL -->
        <!-- where the generated files go -->
        <!-- default value:
             ${project.build.directory}/generated-sources/jcasgen" -->
        <outputDirectory>
        </outputDirectory>

        <!-- true or false, default = false -->
        <!-- if true, then although the complete merged type system
             will be created internally, only those types whose
             definition is contained within this maven project will be
             generated.  The others will be presumed to be
             available via other projects. -->
        <!-- OPTIONAL -->
        <limitToProject>false</limitToProject>
      </configuration>
    </execution>
  </executions>
</plugin>
9. UIMA Plugin for bnd
Bnd is a tooling suite for building OSGi bundles. Its primary function is generating OSGi meta data by analyzing Java classes. However, when using UIMA, it may be necessary to add package imports for packages that contain importable XML files such as UIMA type system descriptions to the OSGi metadata. The UIMA plugin for bnd contributes an analyzer that checks for by-name imports in UIMA XML files and adds the necessary package imports.
To use the this plugin, specify it in the POM as follows:
<plugin>
  <groupId>biz.aQute.bnd</groupId>
  <artifactId>bnd-maven-plugin</artifactId>
  <executions>
    <configuration>
      <bnd>
        -plugin.uima: org.apache.uima.tools.bnd.UimaBndPlugin
      </bnd>
    </configuration>
  </executions>
  <dependencies>
    <dependency>
      <groupId>org.apache.uima</groupId>
      <artifactId>uima-bnd-plugin</artifactId>
      <version>3.7.0-SNAPSHOT</version>
    </dependency>
  </dependencies>
</plugin>
If the plugin is active during a build, it will log a message like
[INFO] UIMA bnd plugin processed 5 imports
If you need more detailed logging, run the Maven build with the -X option.
10. PEAR Packager User’s Guide
A PEAR (Processing Engine ARchive) file is a standard package for UIMA (Unstructured Information Management Architecture) components. The PEAR package can be used for distribution and reuse by other components or applications. It also allows applications and tools to manage UIMA components automatically for verification, deployment, invocation, testing, etc.
This chapter describes how to use the PEAR Eclipse plugin or the PEAR command line packager to create PEAR files for standard UIMA components.
10.1. Using the PEAR Eclipse Plugin
The PEAR Eclipse plugin is automatically installed if you followed the directions in Setup Guide. The use of the plugin involves the following two steps:
-
Add the UIMA nature to your project
-
Create a PEAR file using the PEAR generation wizard
10.1.1. Add UIMA Nature to your project
First, create a project for your UIMA component:
-
Create a Java project, which would contain all the files and folders needed for your UIMA component.
-
Create a source folder called
srcin your project, and make it the only source folder, by clicking on Properties in your project’s context menu (right-click), then select Java Build Path, then add thesrcfolder to the source folders list, and remove any other folder from the list. -
Specify an output folder for your project called bin, by clicking on Properties in your project’s context menu (right-click), then select “Java Build Path”, and specify “your_project_name/bin” as the default output folder.
Then, add the UIMA nature to your project by clicking on Add UIMA Nature in the context menu (right-click) of your project. Click Yes on the Adding UIMA custom Nature dialog box. Click OK on the confirmation dialog box.
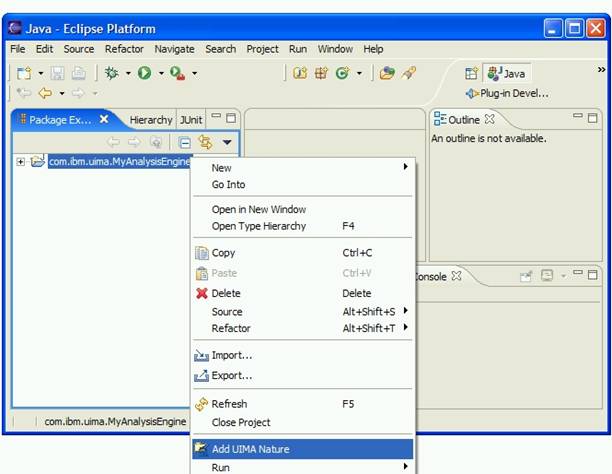
Adding the UIMA nature to your project creates the PEAR structure in your project. The PEAR structure is a structured tree of folders and files, including the following elements:
-
Required Elements:
-
The * metadata* folder which contains the PEAR installation descriptor and properties files.
-
The installation descriptor (
metadata/install.xml`)
-
-
Optional Elements:
-
The
descfolder to contain descriptor files of analysis engines, component analysis engines (all levels), and other component (Collection Readers, CAS Consumers, etc). -
The
srcfolder to contain the source code -
The
binfolder to contain executables, scripts, class files, dlls, shared libraries, etc. -
The
libfolder to contain jar files. -
The
docfolder containing documentation materials, preferably accessible through an index.html. -
The
datafolder to contain data files (e.g. for testing). -
The
conffolder to contain configuration files. -
The
resourcesfolder to contain other resources and dependencies. -
Other user-defined folders or files are allowed, but should be avoided.
-
For more information about the PEAR structure, please refer to the Processing Engine Archive section.
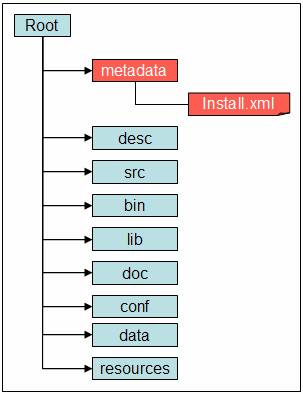
10.1.2. Using the PEAR Generation Wizard
Before using the PEAR Generation Wizard, add all the files needed to run your component including descriptors, jars, external libraries, resources, and component analysis engines (in the case of an aggregate analysis engine), etc. Do not add JARs for the UIMA framework, however. Doing so will cause class loading problems at run time.
If you’re using a Java IDE like Eclipse, instead of using the output folder (usually bin as the source of your classes, it’s recommended that you generate a Jar file containing these classes.
Then, click on “Generate PEAR file” from the context menu (right-click) of your project, to open the PEAR Generation wizard, and follow the instructions on the wizard to generate the PEAR file.
The Component Information page
The first page of the PEAR generation wizard is the component information page. Specify in this page a component ID for your PEAR and select the main Analysis Engine descriptor. The descriptor must be specified using a pathname relative to the project’s root (e.g. “desc/MyAE.xml”). The component id is a string that uniquely identifies the component. It should use the JAVA naming convention (e.g. org.apache.uima.mycomponent).
Optionally, you can include specific Collection Iterator, CAS Initializer (deprecated as of Version 2.1), or CAS Consumers. In this case, specify the corresponding descriptors in this page.
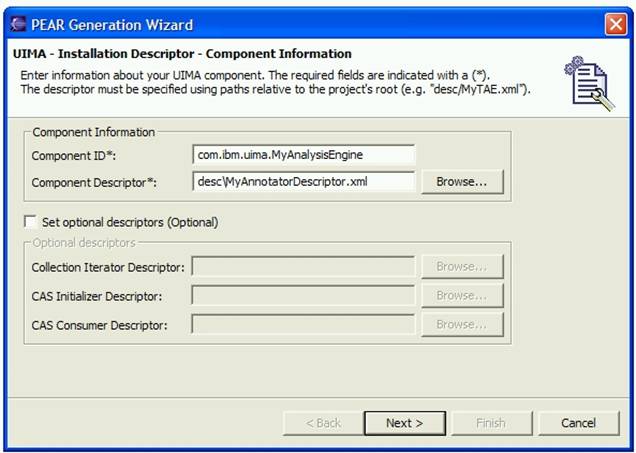
The Installation Environment page
The installation environment page is used to specify the following:
-
Preferred operating system
-
Required JDK version, if applicable.
-
Required Environment variable settings. This is where you specify special CLASSPATH paths. You do not need to specify this for any Jar that is listed in the your eclipse project classpath settings; those are automatically put into the generated CLASSPATH. Nor should you include paths to the UIMA Framework itself, here. Doing so may cause class loading problems.
CLASSPATH segments are written here using a semicolon ";" as the separator; during PEAR installation, these will be adjusted to be the correct character for the target Operating System.
In order to specify the UIMA datapath for your component you have to create an environment variable with the property name
uima.datapath. The value of this property must contain the UIMA datapath settings.
Path names should be specified using macros (see below), instead of hard-coded absolute paths that might work locally, but probably won’t if the PEAR is deployed in a different machine and environment.
Macros are variables such as $main_root, used to represent a string such as the full path of a certain directory.
These macros should be defined in the PEAR.properties file using the local values. The tools and applications that use and deploy PEAR files should replace these macros (in the files included in the conf and desc folders) with the corresponding values in the local environment as part of the deployment process.
Currently, there are two types of macros:
-
$main_root, which represents the local absolute path of the main component root directory after deployment.
-
$component_id$root, which represents the local absolute path to the root directory of the component which has component_id as component ID. This component could be, for instance, a delegate component.
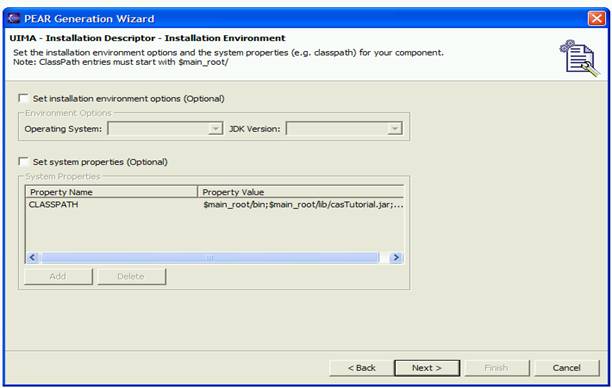
The PEAR file content page
The last page of the wizard is the “PEAR file Export” page, which allows the user to select the files to include in the PEAR file. The metadata folder and all its content is mandatory. Make sure you include all the files needed to run your component including descriptors, jars, external libraries, resources, and component analysis engines (in the case of an aggregate analysis engine), etc. It’s recommended to generate a jar file from your code as an alternative to building the project and making sure the output folder (bin) contains the required class files.
Eclipse compiles your class files into some output directory, often named "bin" when you take the usual defaults in Eclipse.
The recommended practice is to take all these files and put them into a Jar file, perhaps using the Eclipse Export wizard.
You would place that Jar file into the PEAR lib directory.
|
Note
|
If you are relying on the class files generated in the output folder (usually called bin) to run your code, then make sure the project is built properly, and all the required class files are generated without errors, and then put the output folder (e.g. $main_root/bin) in the classpath using the option to set environment variables, by setting the CLASSPATH variable to include this folder (see the “Installation Environment” page. Beware that using a Java output folder named "bin" in this case is a poor practice, because the PEAR installation tools will presume this folder contains binary executable files, and will adds this folder to the PATH environment variable. |
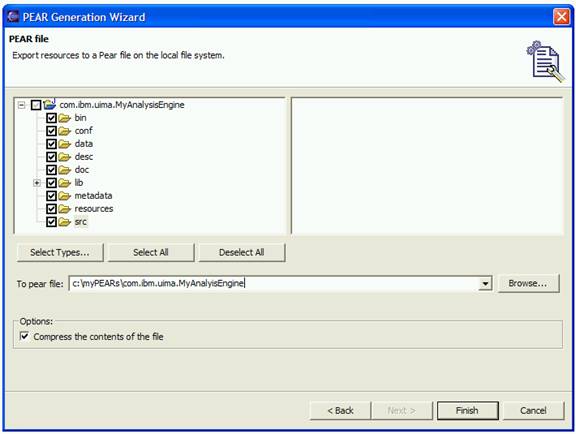
10.2. Using the PEAR command line packager
The PEAR command line packager takes some PEAR package parameter settings on the command line to create an UIMA PEAR file.
To run the PEAR command line packager you can use the provided runPearPackager (.bat for Windows, and .sh for Unix) scripts. The packager can be used in three different modes.
-
Mode 1: creates a complete PEAR package with the provided information (default mode)
runPearPackager -compID <componentID>
  -mainCompDesc <mainComponentDesc> [-classpath <classpath>]
  [-datapath <datapath>] -mainCompDir <mainComponentDir>
  -targetDir <targetDir> [-envVars <propertiesFilePath>]
The created PEAR file has the file name <componentID>.pear and is located in the <targetDir>.
-
Mode 2: creates a PEAR installation descriptor without packaging the PEAR file
runPearPackager -create -compID <componentID>
  -mainCompDesc <mainComponentDesc> [-classpath <classpath>]
  [-datapath <datapath>] -mainCompDir <mainComponentDir>
  [-envVars <propertiesFilePath>]
The PEAR installation descriptor is created in the <mainComponentDir>/metadata directory.
-
Mode 3: creates a PEAR package with an existing PEAR installation descriptor
runPearPackager -package -compID <componentID>
  -mainCompDir <mainComponentDir> -targetDir <targetDir>
The created PEAR file has the file name <componentID>.pear and is located in the <targetDir>.
The modes 2 and 3 should be used when you want to manipulate the PEAR installation descriptor before packaging the PEAR file.
Some more details about the PearPackager parameters is provided in the list below:
-
<componentID>: PEAR package component ID. -
<mainComponentDesc>: Main component descriptor of the PEAR package. -
<classpath>: PEAR classpath settings. Use $main_root macros to specify path entries. Use;to separate the entries. -
<datapath>: PEAR datapath settings. Use $main_root macros to specify path entries. Use;to separate the path entries. -
<mainComponentDir>: Main component directory that contains the PEAR package content. -
<targetDir>: Target directory where the created PEAR file is written to. -
<propertiesFilePath>: Path name to a properties file that contains environment variables that must be set to run the PEAR content.
11. The PEAR Packaging Maven Plugin
UIMA includes a Maven plugin that supports creating PEAR packages using Maven. When configured for a project, it assumes that the project has the PEAR layout, and will copy the standard directories that are part of a PEAR structure under the project root into the PEAR, excluding files that start with a period ("."). It also will put the Jar that is built for the project into the lib/ directory and include it first on the generated classpath.
The classpath that is generated for this includes the artifact’s Jar first, any user specified entries second (in the order they are specified), and finally, entries for all Jars found in the lib/ directory (in some arbitrary order).
11.1. Specifying the PEAR Packaging Maven Plugin
To use the PEAR Packaging Plugin within a Maven build, the plugin must be added to the plugins section of the Maven POM as shown below:
<build>
 <plugins>
  ...
  <plugin>
    <groupId>org.apache.uima</groupId>
    <artifactId>PearPackagingMavenPlugin</artifactId>

    <!-- if version is omitted, then -->
    <!-- version is inherited from parent's pluginManagement section -->
    <!-- otherwise, include a version element here -->

    <!-- says to load Maven extensions
         (such as packaging and type handlers) from this plugin -->
    <extensions>true</extensions>
    <executions>
      <execution>
        <phase>package</phase>
        <!-- where you specify details of the thing being packaged -->
        <configuration>

          <classpath>
            <!-- PEAR file component classpath settings -->
            $main_root/lib/sample.jar
          </classpath>

          <mainComponentDesc>
            <!-- PEAR file main component descriptor -->
            desc/${artifactId}.xml
          </mainComponentDesc>

          <componentId>
            <!-- PEAR file component ID -->
            ${artifactId}
          </componentId>

          <datapath>
            <!-- PEAR file UIMA datapath settings -->
            $main_root/resources
          </datapath>

        </configuration>
        <goals>
          <goal>package</goal>
        </goals>
      </execution>
    </executions>
  </plugin>
  ...
 </plugins>
</build>
To configure the plugin with the specific settings of a PEAR package, the <configuration> element section is used.
This sections contains all parameters that are used by the PEAR Packaging Plugin to package the right content and set the specific PEAR package settings.
The details about each parameter and how it is used is shown below:
-
<classpath>- This element specifies the classpath settings for the PEAR component. The Jar artifact that is built during the current Maven build is automatically added to the PEAR classpath settings and does not have to be added manually. In addition, all Jars in the lib directory and its subdirectories will be added to the generated classpath when the PEAR is installed.NoteUse $main_root variables to refer to libraries inside the PEAR package. For more details about PEAR packaging please refer to the Apache UIMA PEAR documentation.
-
<mainComponentDesc>- This element specifies the relative path to the main component descriptor that should be used to run the PEAR content. The path must be relative to the project root. A good default to use isdesc/${artifactId}.xml. -
<componentID>- This element specifies the PEAR package component ID. A good default to use is${artifactId}. -
<datapath>- This element specifies the PEAR package UIMA datapath settings. If no datapath settings are necessary, this element can be omitted.NoteUse $main_root variables to refer libraries inside the PEAR package. For more details about PEAR packaging please refer to the Apache UIMA PEAR documentation.
For most Maven projects it is sufficient to specify the parameters described above. In some cases, for more complex projects, it may be necessary to specify some additional configuration parameters. These parameters are listed below with the default values that are used if they are not added to the configuration section shown above.
-
<mainComponentDir>- This element specifies the main component directory where the UIMA nature is applied. By default this parameter points to the project root directory - ${basedir}. -
<targetDir>- This element specifies the target directory where the result of the plugin are written to. By default this parameters points to the default Maven output directory - ${basedir}/target
11.2. Automatically including dependencies
A key concept in PEARs is that they allow specifying other Jars in the classpath. You can optionally include these Jars within the PEAR package.
The PEAR Packaging Plugin does not take care of automatically adding these Jars (that the PEAR might depend on) to the PEAR archive. However, this behavior can be manually added to your Maven POM. The following two build plugins hook into the build cycle and insure that all runtime dependencies are included in the PEAR file.
The dependencies will be automatically included in the PEAR file using this procedure; the PEAR install process also will automatically adds all files in the lib directory (and sub directories) to the classpath.
The maven-dependency-plugin copies the runtime dependencies of the PEAR into the lib folder, which is where the PEAR packaging plugin expects them.
<build>
 <plugins>
  ...
  <plugin>
   <groupId>org.apache.maven.plugins</groupId>
   <artifactId>maven-dependency-plugin</artifactId>
   <executions>
    <!-- Copy the dependencies to the lib folder for the PEAR to copy -->
    <execution>
     <id>copy-dependencies</id>
     <phase>package</phase>
     <goals>
      <goal>copy-dependencies</goal>
     </goals>
     <configuration>
      <outputDirectory>${basedir}/lib</outputDirectory>
      <overWriteSnapshots>true</overWriteSnapshots>
      <includeScope>runtime</includeScope>
     </configuration>
    </execution>
   </executions>
  </plugin>
  ...
 </plugins>
</build>
The second Maven plug-in hooks into the clean phase of the build life-cycle, and deletes the lib folder.
|
Note
|
With this approach, the |
<build>
 <plugins>
  ...
  <plugin>
   <artifactId>maven-antrun-plugin</artifactId>
   <executions>
    <!-- Clean the libraries after packaging -->
    <execution>
     <id>CleanLib</id>
     <phase>clean</phase>
     <configuration>
      <tasks>
       <delete quiet="true"
               failOnError="false">
        <fileset dir="lib" includes="**/*.jar"/>
       </delete>
      </tasks>
     </configuration>
     <goals>
      <goal>run</goal>
     </goals>
    </execution>
   </executions>
  </plugin>
  ...
 </plugins>
</build>
11.3. Running from the command line
The PEAR packager can be run as a maven command. To enable this, you have to add the following to your maven settings file:
<settings>
  ...
  <pluginGroups>
    <pluginGroup>org.apache.uima</pluginGroup>
  </pluginGroups>
To invoke the PEAR packager using maven, use the command:
mvn uima-pear:package <parameters...>The settings are the same ones used in the configuration above, specified as -D variables where the variable name is pear.parameterName`.
For example:
mvn uima-pear:package -Dpear.mainComponentDesc=desc/mydescriptor.xml
                      -Dpear.componentId=foo
12. PEAR Installer User’s Guide
PEAR (Processing Engine ARchive) is a new standard for packaging UIMA compliant components. This standard defines several service elements that should be included in the archive package to enable automated installation of the encapsulated UIMA component. The major PEAR service element is an XML Installation Descriptor that specifies installation platform, component attributes, custom installation procedures and environment variables.
The installation of a UIMA compliant component includes 2 steps: (1) installation of the component code and resources in a local file system, and (2) verification of the serviceability of the installed component. Installation of the component code and resources involves extracting component files from the archive (PEAR) package in a designated directory and localizing file references in component descriptors and other configuration files. Verification of the component serviceability is accomplished with the help of standard UIMA mechanisms for instantiating analysis engines.
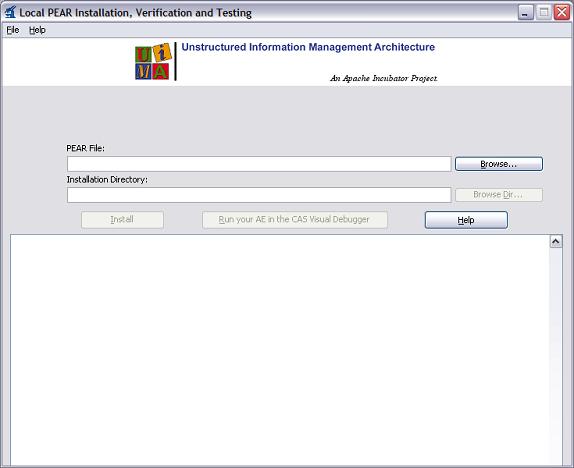
There are two versions of the PEAR Installer.
One is an interactive, GUI-based application which puts up a panel asking for the parameters of the installation; the other is a command line interface version where you pass the parameters needed on the command line itself.
To launch the GUI version of the PEAR Installer, use the script in the UIMA bin directory: runPearInstaller.bat or runPearInstaller.sh. The command line is launched using runPearInstallerCli.cmd or runPearInstallerCli.sh.
The PEAR Installer installs UIMA compliant components (analysis engines) from PEAR packages in a local file system. To install a desired UIMA component the user needs to select the appropriate PEAR file in a local file system and specify the installation directory (optional). If no installation directory is specified, the PEAR file is installed to the current working directory. By default the PEAR packages are not installed directly to the specified installation directory. For each PEAR a subdirectory with the name of the PEAR’s ID is created where the PEAR package is installed to. If the PEAR installation directory already exists, the old content is automatically deleted before the new content is installed. During the component installation the user can read messages printed by the installation program in the message area of the application window. If the installation fails, appropriate error message is printed to help identifying and fixing the problem.
After the desired UIMA component is successfully installed, the PEAR Installer allows testing this component in the CAS Visual Debugger (CVD) application, which is provided with the UIMA package.
The CVD application will load your UIMA component using its XML descriptor file.
If the component is loaded successfully, you’ll be able to run it either with sample documents provided in the <UIMA_HOME>/examples/data directory, or with any other sample documents.
Running your component in the CVD application helps to make sure the component will run in other UIMA applications.
If the CVD application fails to load or run your component, or throws an exception, you can find more information about the problem in the uima.log file in the current working directory.
The log file can be viewed with the CVD.
PEAR Installer creates a file named setenv.txt in the <component_root>/metadata directory.
This file contains environment variables required to run your component in any UIMA application.
It also creates a PEAR descriptor file named <componentID>_pear.xml in the <component_root> directory that can be used to directly run the installed pear file in your application.
The metadata/setenv.txt is not read by the UIMA framework anywhere.
It’s there for use by non-UIMA application code if that code wants to set environment variables.
The metadata/setenv.txt is just a "convenience" file duplicating what is in the XML.
The setenv.txt file has two special variables: the CLASSPATH and the PATH.
The CLASSPATH is computed from any supplied CLASSPATH environment variable, plus the jars that are configured in the PEAR structure, including subcomponents.
The PATH is similarly computed, using any supplied PATH environment variable plus it includes the bin subdirectory of the PEAR structure, if it exists.
The command line version of the PEAR installer has one required argument: the path to the PEAR file being installed.
A second argument can specify the installation directory (default is the current working directory). An optional argument, one of -c or -check or -verify, causes verification to be done after installation, as described above.
13. PEAR Merger User’s Guide
The PEAR Merger utility takes two or more PEAR files and merges their contents, creating a new PEAR which has, in turn, a new Aggregate analysis engine whose delegates are the components from the original files being merged. It does this by (1) copying the contents of the input components into the output component, placing each component into a separate subdirectory, (2) generating a UIMA descriptor for the output Aggregate analysis engine and (3) creating an output PEAR file that encapsulates the output Aggregate.
The merge logic is quite simple, and is intended to work for simple cases. More complex merging needs to be done by hand. Please see the Restrictions and Limitations section, below.
To run the PearMerger command line utility you can use the runPearMerger scripts (.bat for Windows, and .sh for Unix). The usage of the tooling is shown below:
runPearMerger 1st_input_pear_file ... nth_input_pear_file
  -n output_analysis_engine_name [-f output_pear_file ]
The first group of parameters are the input PEAR files.
No duplicates are allowed here.
The -n parameter is the name of the generated Aggregate Analysis Engine.
The optional -f parameter specifies the name of the output file.
If it is omitted, the output is written to output_analysis_engine_name.pear in the current working directory.
During the running of this tool, work files are written to a temporary directory created in the user’s home directory.
13.1. Details of the merging process
The PEARs are merged using the following steps:
-
A temporary working directory, is created for the output aggregate component.
-
Each input PEAR file is extracted into a separate 'input_component_name' folder under the working directory.
-
The extracted files are processed to adjust the '$main_root' macros. This operation differs from the PEAR installation operation, because it does not replace the macros with absolute paths.
-
The output PEAR directory structure, 'metadata' and 'desc' folders under the working directory, are created.
-
The UIMA AE descriptor for the output aggregate component is built in the 'desc' folder. This aggregate descriptor refers to the input delegate components, specifying 'fixed flow' based on the original order of the input components in the command line. The aggregate descriptor’s 'capabilities' and 'operational properties' sections are built based on the input components' specifications.
-
A new PEAR installation descriptor is created in the 'metadata' folder, referencing the new output aggregate descriptor built in the previous step.
-
The content of the temporary output working directory is zipped to created the output PEAR, and then the temporary working directory is deleted.
The PEAR merger utility logs all the operations both to standard console output and to a log file, pm.log, which is created in the current working directory.
13.2. Testing and Modifying the resulting PEAR
The output PEAR file can be installed and tested using the PEAR Installer. The output aggregate component can also be tested by using the CVD or DocAnalyzer tools.
The PEAR Installer creates Eclipse project files (.classpath and .project) in the root directory of the installer PEAR, so the installed component can be imported into the Eclipse IDE as an external project. Once the component is in the Eclipse IDE, developers may use the Component Descriptor Editor and the PEAR Packager to modify the output aggregate descriptor and re-package the component.
13.3. Restrictions and Limitations
The PEAR Merger utility only does basic merging operations, and is limited as follows. You can overcome these by editing the resulting PEAR file or the resulting Aggregate Descriptor.
-
The Merge operation specifies Fixed Flow sequencing for the Aggregate.
-
The merged aggregate does not define any parameters, so the delegate parameters cannot be overridden.
-
No External Resource definitions are generated for the aggregate.
-
No Sofa Mappings are generated for the aggregate.
-
Name collisions are not checked for. Possible name collisions could occur in the fully-qualified class names of the implementing Java classes, the names of JAR files, the names of descriptor files, and the names of resource bindings or resource file paths.
-
The input and output capabilities are generated based on merging the capabilities from the components (removing duplicates). Capability sets are ignored - only the first of the set is used in this process, and only one set is created for the generated Aggregate. There is no support for merging Sofa specifications.
-
No Indexes or Type Priorities are created for the generated Aggregate. No checking is done to see if the Indexes or Type Priorities of the components conflict or are inconsistent.
-
You can only merge Analysis Engines and CAS Consumers.
-
Although PEAR file installation descriptors that are being merged can have specific XML elements describing Collection Reader and CAS Consumer descriptors, these elements are ignored during the merge, in the sense that the installation descriptor that is created by the merge does not set these elements. The merge process does not use these elements; the output PEAR’s new aggregate only references the merged components' main PEAR descriptor element, as identified by the PEAR element:
<SUBMITTED_COMPONENT>
  <DESC>the_component.xml</DESC>...
</SUBMITTED_COMPONENT>
