Real Time Reporting with the Table API #
Apache Flink offers a Table API as a unified, relational API for batch and stream processing, i.e., queries are executed with the same semantics on unbounded, real-time streams or bounded, batch data sets and produce the same results. The Table API in Flink is commonly used to ease the definition of data analytics, data pipelining, and ETL applications.
What Will You Be Building? #
In this tutorial, you will learn how to build a real-time dashboard to track financial transactions by account. The pipeline will read data from Kafka and write the results to MySQL visualized via Grafana.
Prerequisites #
This walkthrough assumes that you have some familiarity with Java, but you should be able to follow along even if you come from a different programming language.
It also assumes that you are familiar with basic relational concepts such as SELECT and GROUP BY clauses.
Help, I’m Stuck! #
If you get stuck, check out the community support resources. In particular, Apache Flink’s user mailing list consistently ranks as one of the most active of any Apache project and a great way to get help quickly.
If running docker on Windows and your data generator container is failing to start, then please ensure that you’re using the right shell. For example docker-entrypoint.sh for table-walkthrough_data-generator_1 container requires bash. If unavailable, it will throw an error standard_init_linux.go:211: exec user process caused “no such file or directory”. A workaround is to switch the shell to sh on the first line of docker-entrypoint.sh.
How To Follow Along #
If you want to follow along, you will require a computer with:
- Java 11
- Maven
- Docker
The required configuration files are available in the flink-playgrounds repository.
Once downloaded, open the project flink-playground/table-walkthrough in your IDE and navigate to the file SpendReport.
EnvironmentSettings settings = EnvironmentSettings.inStreamingMode();
TableEnvironment tEnv = TableEnvironment.create(settings);

tEnv.executeSql("CREATE TABLE transactions (\n" +
    "    account_id  BIGINT,\n" +
    "    amount      BIGINT,\n" +
    "    transaction_time TIMESTAMP(3),\n" +
    "    WATERMARK FOR transaction_time AS transaction_time - INTERVAL '5' SECOND\n" +
    ") WITH (\n" +
    "    'connector' = 'kafka',\n" +
    "    'topic'     = 'transactions',\n" +
    "    'properties.bootstrap.servers' = 'kafka:9092',\n" +
    "    'format'    = 'csv'\n" +
    ")");

tEnv.executeSql("CREATE TABLE spend_report (\n" +
    "    account_id BIGINT,\n" +
    "    log_ts     TIMESTAMP(3),\n" +
    "    amount     BIGINT\n," +
    "    PRIMARY KEY (account_id, log_ts) NOT ENFORCED" +
    ") WITH (\n" +
    "   'connector'  = 'jdbc',\n" +
    "   'url'        = 'jdbc:mysql://mysql:3306/sql-demo',\n" +
    "   'table-name' = 'spend_report',\n" +
    "   'driver'     = 'com.mysql.jdbc.Driver',\n" +
    "   'username'   = 'sql-demo',\n" +
    "   'password'   = 'demo-sql'\n" +
    ")");

Table transactions = tEnv.from("transactions");
report(transactions).executeInsert("spend_report");
Breaking Down The Code #
The Execution Environment #
The first two lines set up your TableEnvironment.
The table environment is how you can set properties for your Job, specify whether you are writing a batch or a streaming application, and create your sources.
This walkthrough creates a standard table environment that uses the streaming execution.
EnvironmentSettings settings = EnvironmentSettings.inStreamingMode();
TableEnvironment tEnv = TableEnvironment.create(settings);
Registering Tables #
Next, tables are registered in the current catalog that you can use to connect to external systems for reading and writing both batch and streaming data. A table source provides access to data stored in external systems, such as a database, a key-value store, a message queue, or a file system. A table sink emits a table to an external storage system. Depending on the type of source and sink, they support different formats such as CSV, JSON, Avro, or Parquet.
tEnv.executeSql("CREATE TABLE transactions (\n" +
     "    account_id  BIGINT,\n" +
     "    amount      BIGINT,\n" +
     "    transaction_time TIMESTAMP(3),\n" +
     "    WATERMARK FOR transaction_time AS transaction_time - INTERVAL '5' SECOND\n" +
     ") WITH (\n" +
     "    'connector' = 'kafka',\n" +
     "    'topic'     = 'transactions',\n" +
     "    'properties.bootstrap.servers' = 'kafka:9092',\n" +
     "    'format'    = 'csv'\n" +
     ")");
Two tables are registered; a transaction input table, and a spend report output table.
The transactions (transactions) table lets us read credit card transactions, which contain account ID’s (account_id), timestamps (transaction_time), and US$ amounts (amount).
The table is a logical view over a Kafka topic called transactions containing CSV data.
tEnv.executeSql("CREATE TABLE spend_report (\n" +
    "    account_id BIGINT,\n" +
    "    log_ts     TIMESTAMP(3),\n" +
    "    amount     BIGINT\n," +
    "    PRIMARY KEY (account_id, log_ts) NOT ENFORCED" +
    ") WITH (\n" +
    "    'connector'  = 'jdbc',\n" +
    "    'url'        = 'jdbc:mysql://mysql:3306/sql-demo',\n" +
    "    'table-name' = 'spend_report',\n" +
    "    'driver'     = 'com.mysql.jdbc.Driver',\n" +
    "    'username'   = 'sql-demo',\n" +
    "    'password'   = 'demo-sql'\n" +
    ")");
The second table, spend_report, stores the final results of the aggregation.
Its underlying storage is a table in a MySql database.
The Query #
With the environment configured and tables registered, you are ready to build your first application.
From the TableEnvironment you can read from an input table to read its rows and then write those results into an output table using executeInsert.
The report function is where you will implement your business logic.
It is currently unimplemented.
Table transactions = tEnv.from("transactions");
report(transactions).executeInsert("spend_report");
Testing #
The project contains a secondary testing class SpendReportTest that validates the logic of the report.
It creates a table environment in batch mode.
EnvironmentSettings settings = EnvironmentSettings.inBatchMode();
TableEnvironment tEnv = TableEnvironment.create(settings);
One of Flink’s unique properties is that it provides consistent semantics across batch and streaming. This means you can develop and test applications in batch mode on static datasets, and deploy to production as streaming applications.
Attempt One #
Now with the skeleton of a Job set-up, you are ready to add some business logic. The goal is to build a report that shows the total spend for each account across each hour of the day. This means the timestamp column needs be be rounded down from millisecond to hour granularity.
Flink supports developing relational applications in pure SQL or using the Table API.
The Table API is a fluent DSL inspired by SQL, that can be written in Java or Python and supports strong IDE integration.
Just like a SQL query, Table programs can select the required fields and group by your keys.
These features, along with built-in functions like floor and sum, enable you to write this report.
public static Table report(Table transactions) {
    return transactions.select(
            $("account_id"),
            $("transaction_time").floor(TimeIntervalUnit.HOUR).as("log_ts"),
            $("amount"))
        .groupBy($("account_id"), $("log_ts"))
        .select(
            $("account_id"),
            $("log_ts"),
            $("amount").sum().as("amount"));
}
User Defined Functions #
Flink contains a limited number of built-in functions, and sometimes you need to extend it with a user-defined function.
If floor wasn’t predefined, you could implement it yourself.
import java.time.LocalDateTime;
import java.time.temporal.ChronoUnit;

import org.apache.flink.table.annotation.DataTypeHint;
import org.apache.flink.table.functions.ScalarFunction;

public class MyFloor extends ScalarFunction {

    public @DataTypeHint("TIMESTAMP(3)") LocalDateTime eval(
        @DataTypeHint("TIMESTAMP(3)") LocalDateTime timestamp) {

        return timestamp.truncatedTo(ChronoUnit.HOURS);
    }
}
And then quickly integrate it in your application.
public static Table report(Table transactions) {
    return transactions.select(
            $("account_id"),
            call(MyFloor.class, $("transaction_time")).as("log_ts"),
            $("amount"))
        .groupBy($("account_id"), $("log_ts"))
        .select(
            $("account_id"),
            $("log_ts"),
            $("amount").sum().as("amount"));
}
This query consumes all records from the transactions table, calculates the report, and outputs the results in an efficient, scalable manner.
Running the test with this implementation will pass.
Adding Windows #
Grouping data based on time is a typical operation in data processing, especially when working with infinite streams.
A grouping based on time is called a window and Flink offers flexible windowing semantics.
The most basic type of window is called a Tumble window, which has a fixed size and whose buckets do not overlap.
public static Table report(Table transactions) {
    return transactions
        .window(Tumble.over(lit(1).hour()).on($("transaction_time")).as("log_ts"))
        .groupBy($("account_id"), $("log_ts"))
        .select(
            $("account_id"),
            $("log_ts").start().as("log_ts"),
            $("amount").sum().as("amount"));
}
This defines your application as using one hour tumbling windows based on the timestamp column.
So a row with timestamp 2019-06-01 01:23:47 is put in the 2019-06-01 01:00:00 window.
Aggregations based on time are unique because time, as opposed to other attributes, generally moves forward in a continuous streaming application.
Unlike floor and your UDF, window functions are intrinsics, which allows the runtime to apply additional optimizations.
In a batch context, windows offer a convenient API for grouping records by a timestamp attribute.
Running the test with this implementation will also pass.
Once More, With Streaming! #
And that’s it, a fully functional, stateful, distributed streaming application! The query continuously consumes the stream of transactions from Kafka, computes the hourly spendings, and emits results as soon as they are ready. Since the input is unbounded, the query keeps running until it is manually stopped. And because the Job uses time window-based aggregations, Flink can perform specific optimizations such as state clean up when the framework knows that no more records will arrive for a particular window.
The table playground is fully dockerized and runnable locally as streaming application. The environment contains a Kafka topic, a continuous data generator, MySql, and Grafana.
From within the table-walkthrough folder start the docker-compose script.
$ docker-compose build
$ docker-compose up -d
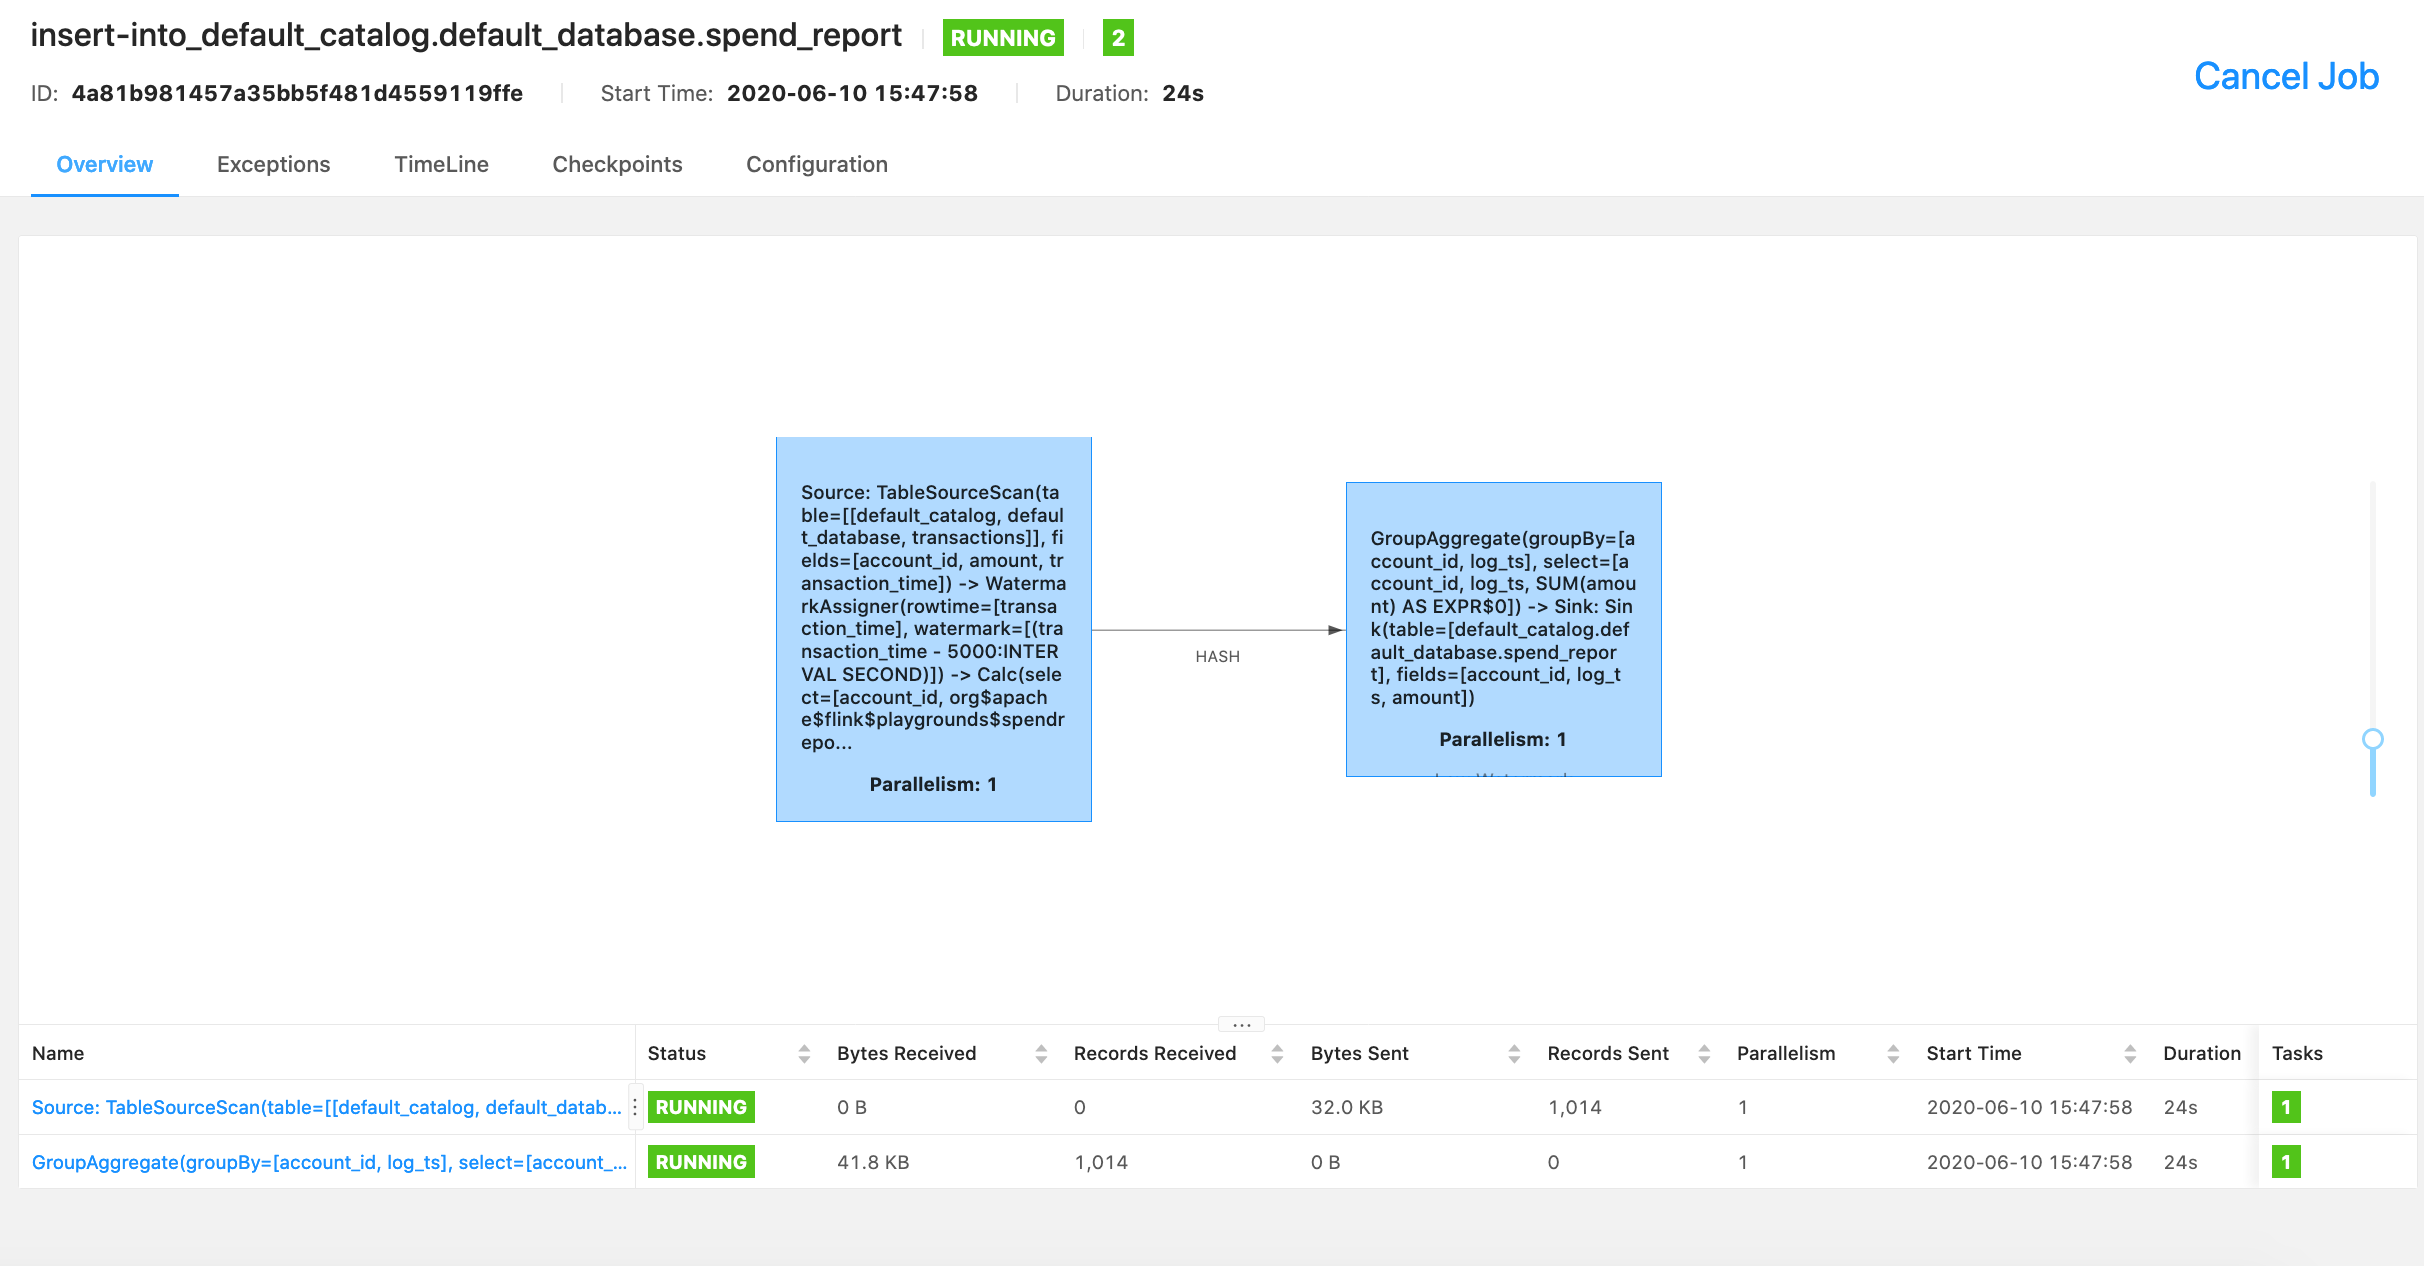
You can see information on the running job via the Flink console.

Explore the results from inside MySQL.
$ docker-compose exec mysql mysql -Dsql-demo -usql-demo -pdemo-sql

mysql> use sql-demo;
Database changed

mysql> select count(*) from spend_report;
+----------+
| count(*) |
+----------+
|      110 |
+----------+
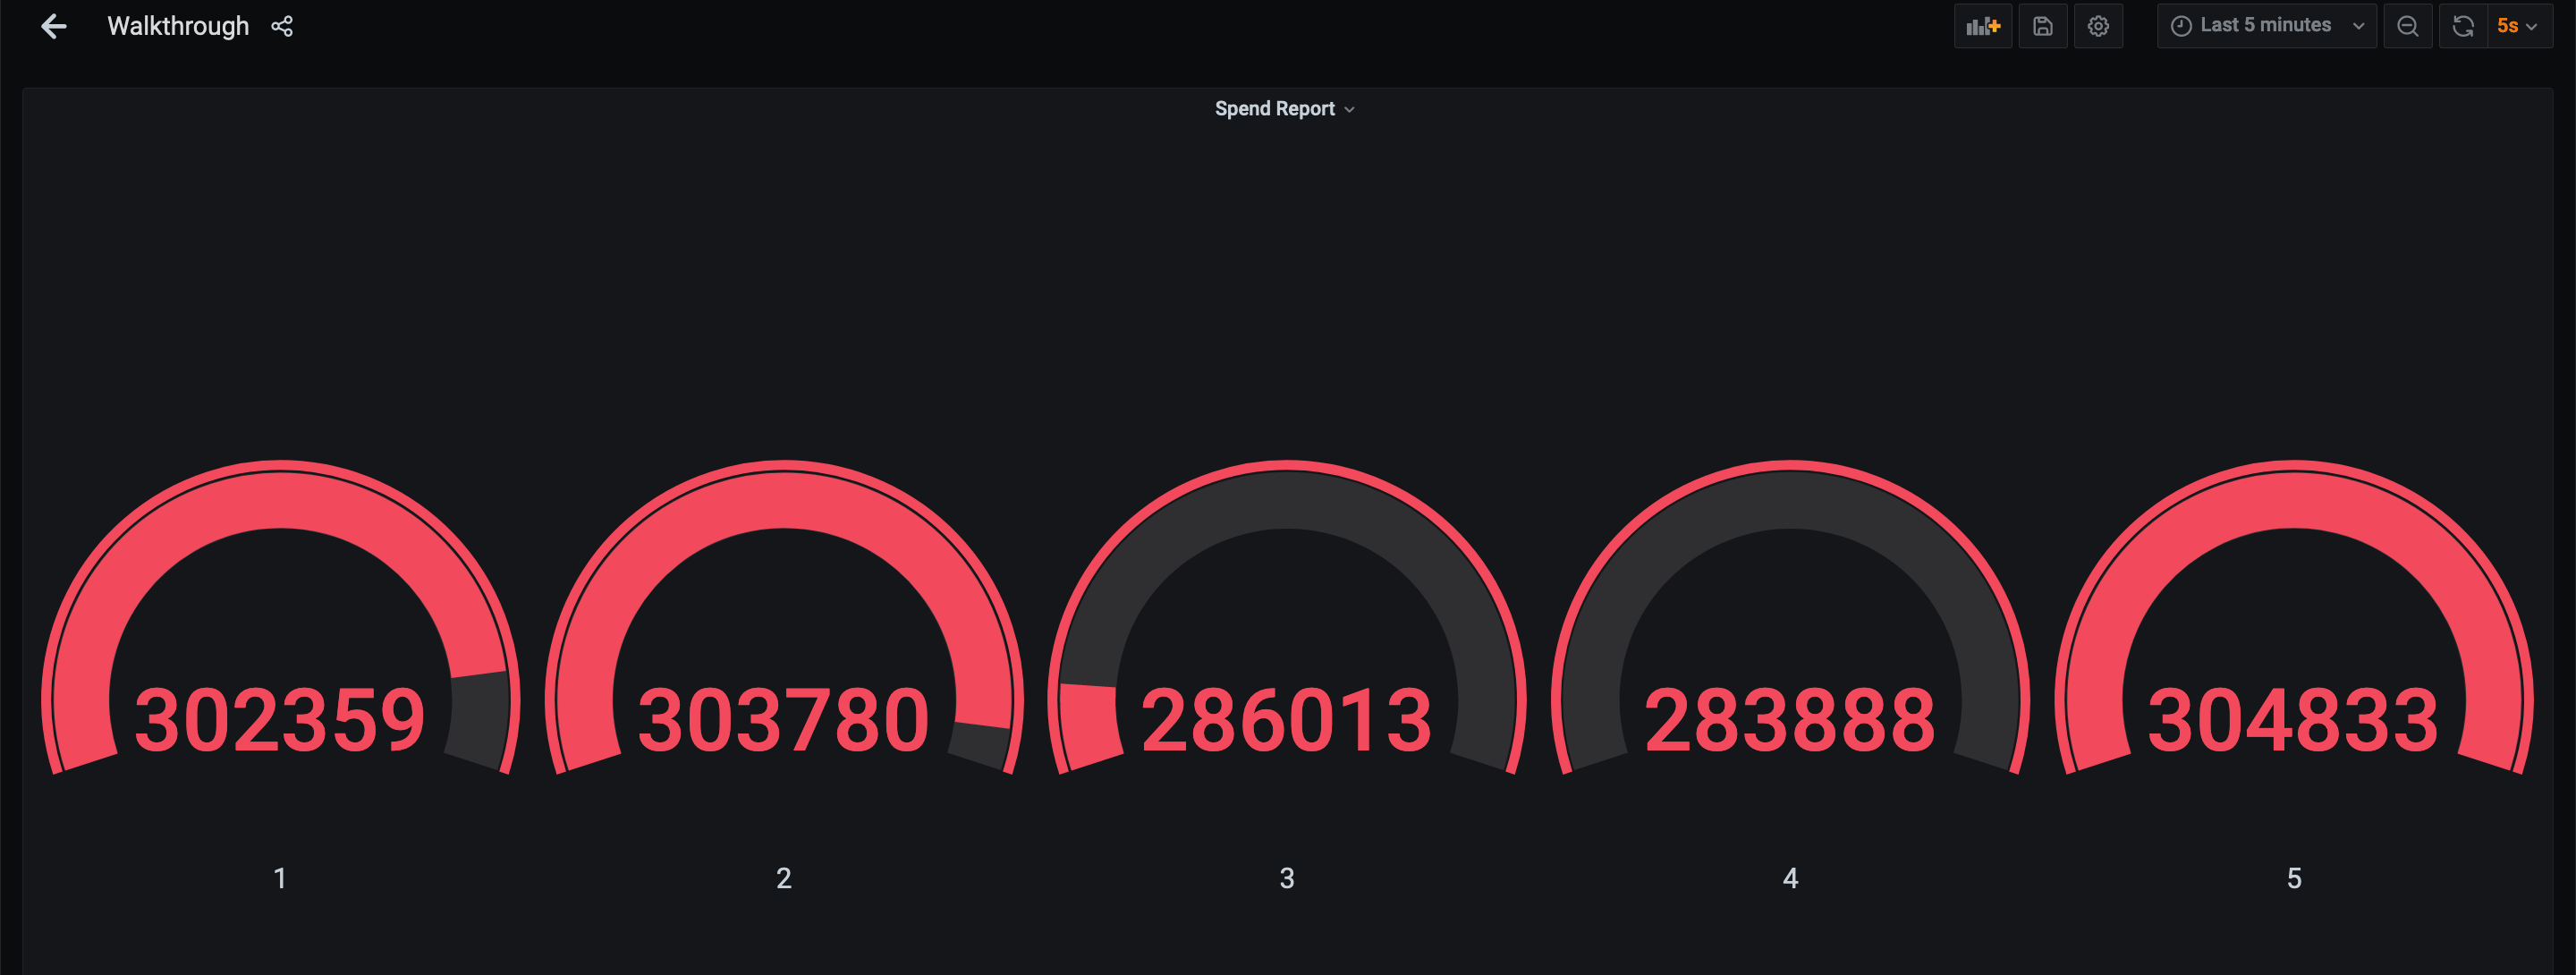
Finally, go to Grafana to see the fully visualized result!
